West of England | www.westpandi.com
2015/16 financial year results
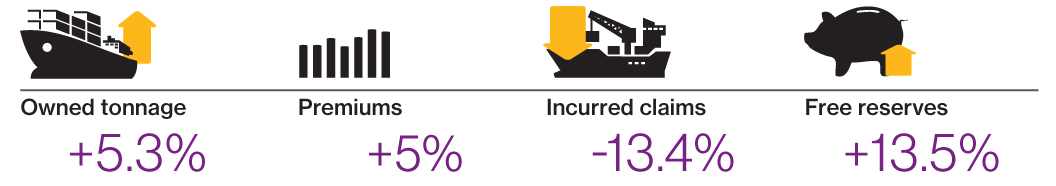
- Owned tonnage increased by 5.3%
- Premiums increased by 5%
- Gross and net paid claims reduced by 18.3% and 15.6% respectively
- -13.4% reduction in net incurred claims
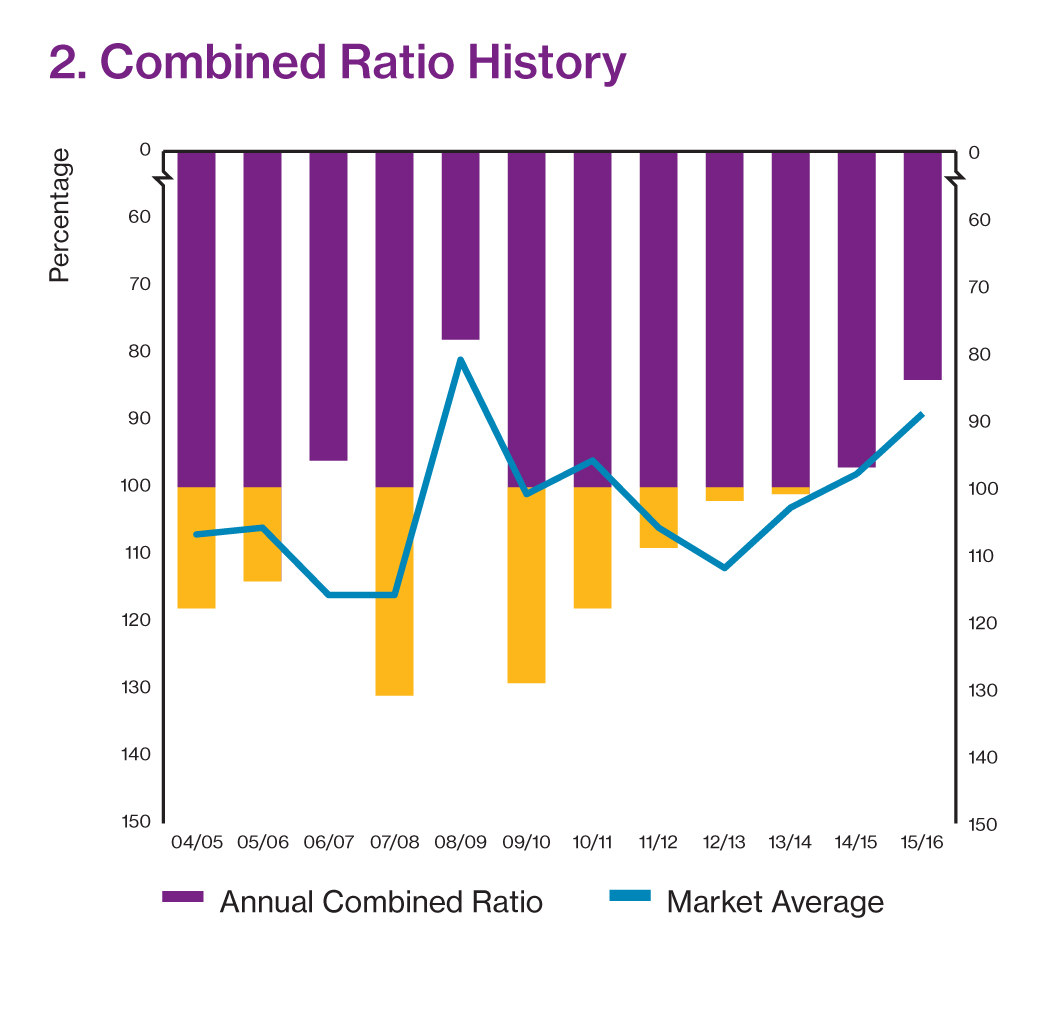
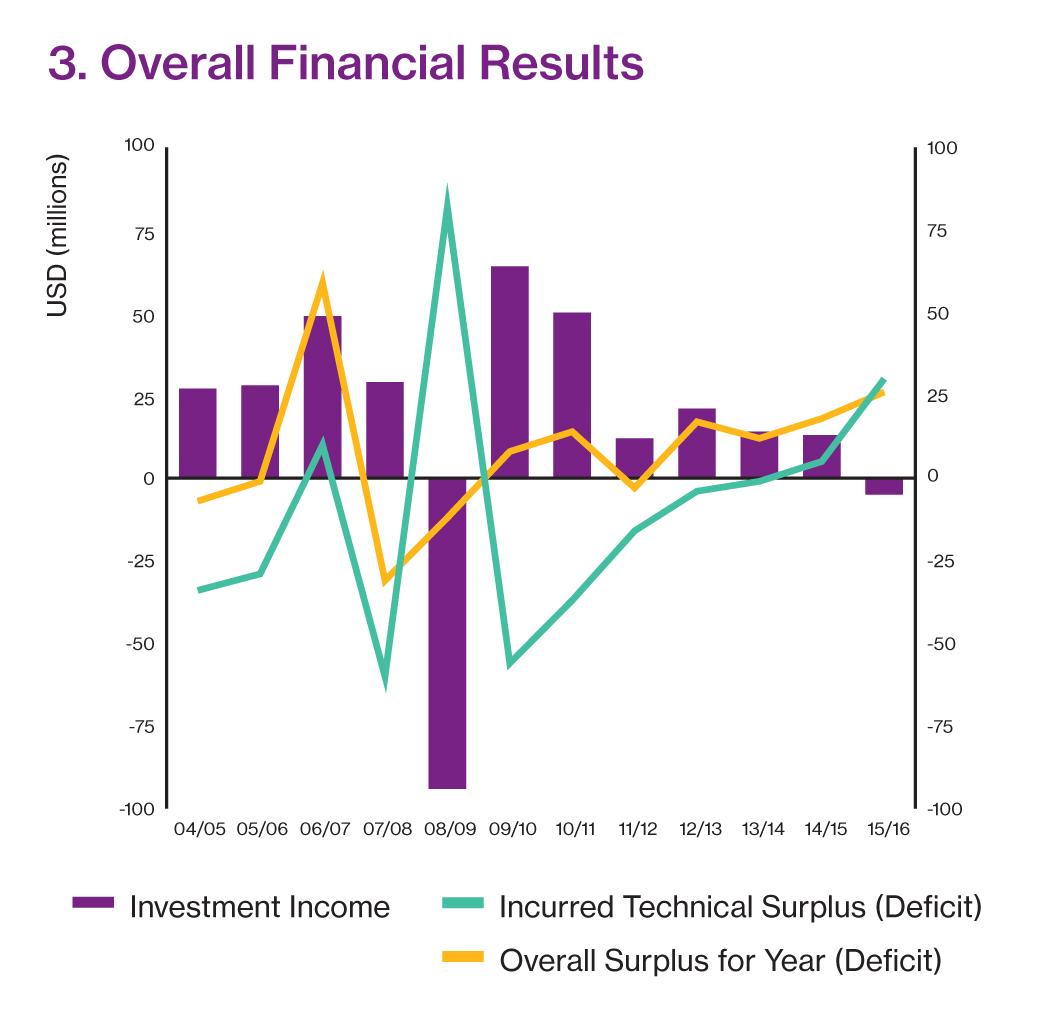
- Significant, USD 30.1 million underwriting surplus
- 0.8% return on investments
- Overall surplus increased from USD 18m in 2014/15 to USD 25.6m in 2015/16
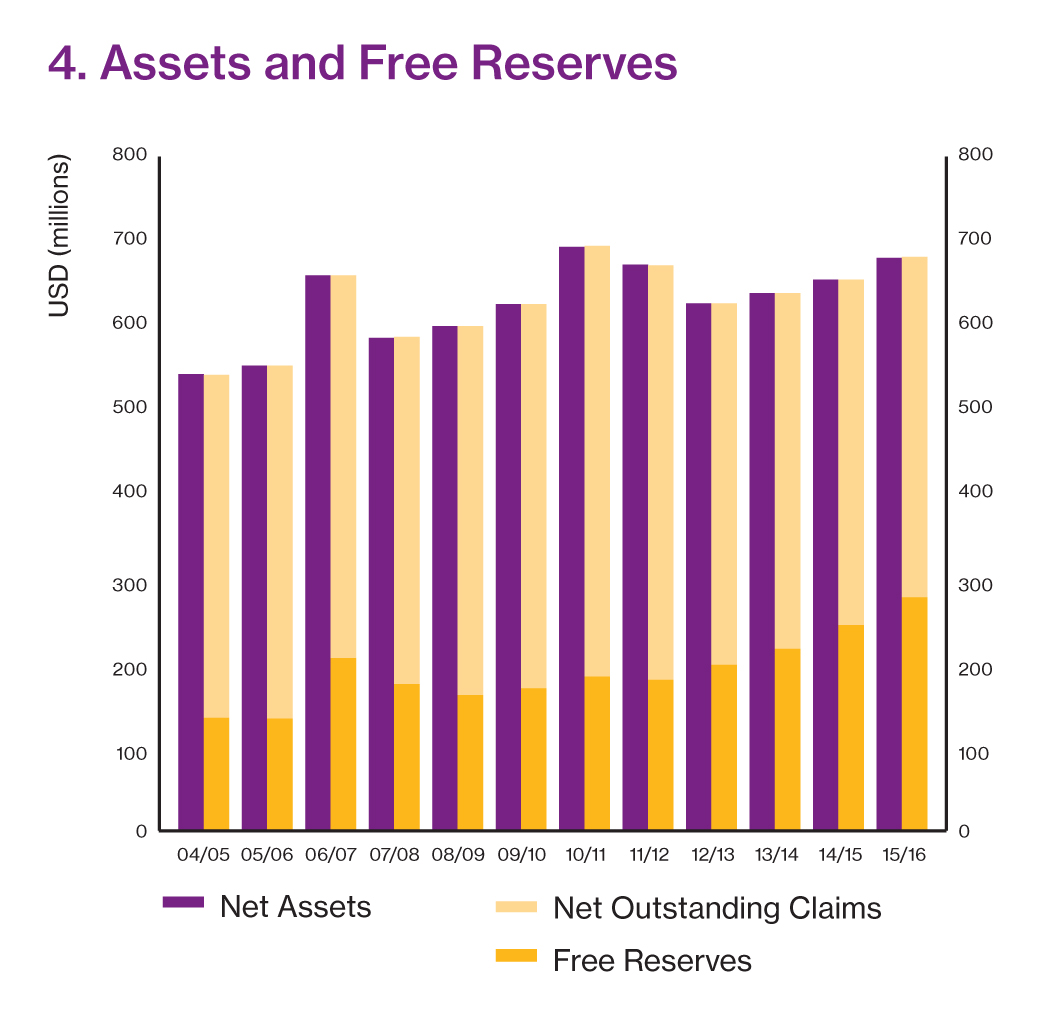
- Assets increased by 4%, free reserves increased by 13.5%
Consolidated Financial Year Summary (USD 000s)
|
2013/14 |
2014/15 |
2015/16 |
| Income and Expenditure |
|
|
|
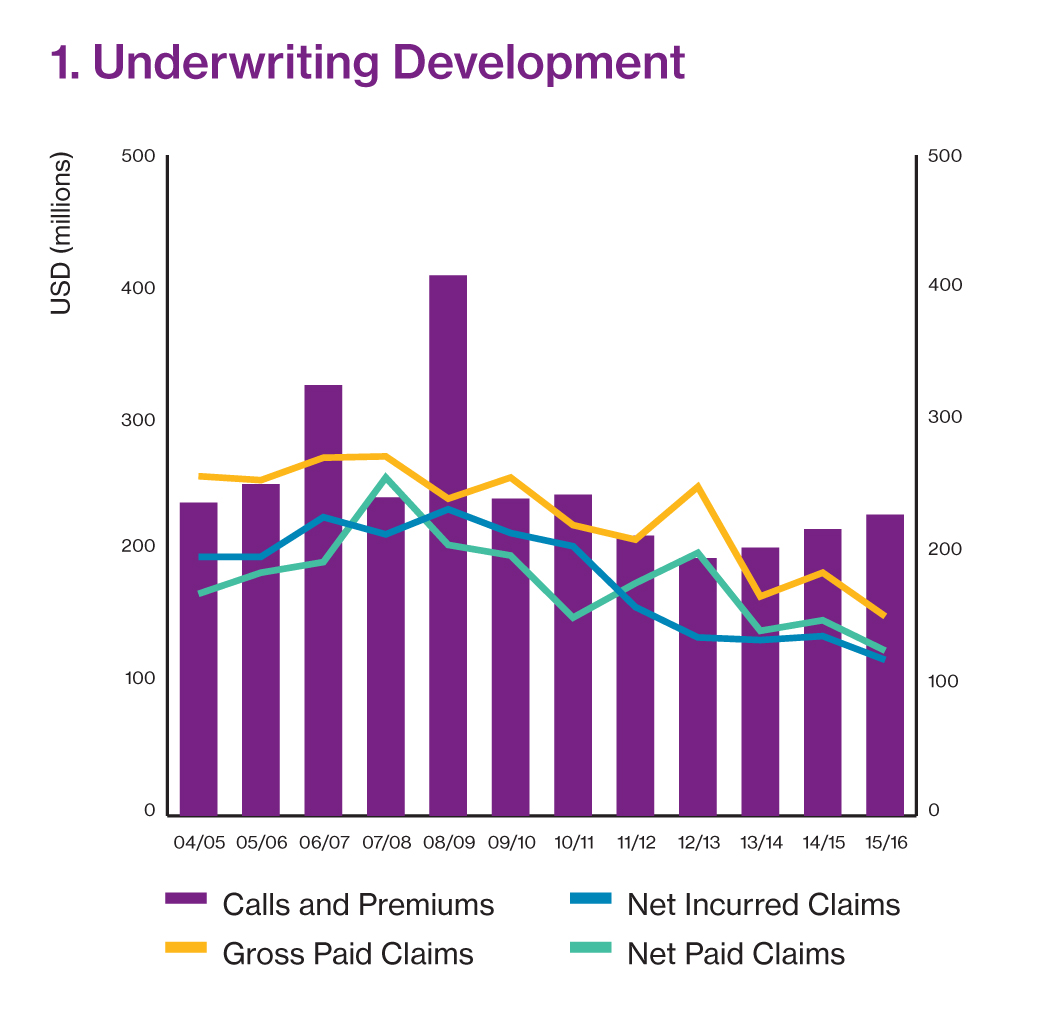
| Calls and Premiums |
203,311 |
216,798 |
227,614 |
| Reinsurance Premiums |
-36,369 |
-40,619 |
-43,927 |
| Operating Expenses |
-34,854 |
-35,350 |
-35,466 |
| Operating Income |
132,088 |
140,829 |
148,221 |
| Gross Paid Claims |
166,101 |
184,185 |
150,528 |
| Net Paid Claims |
140,235 |
147,843 |
124,853 |
| Net Change in Provision for Claims |
-6,750 |
-11,563 |
-6,781 |
| Net Incurred Claims |
133,485 |
136,280 |
118,072 |
| Technical Surplus (Deficit) |
-1,397 |
4,549 |
30,149 |
| Investment Income |
13,748 |
13,445 |
-4,527 |
| Overall Surplus for Year (Deficit) |
12,351 |
17,994 |
25,622 |
| |
|
|
|
| Balance sheet |
|
|
|
| Net Assets |
638,045 |
653,978 |
680,166 |
| Net Outstanding Claims |
421,849 |
410,286 |
403,505 |
| Free Reserves |
216,196 |
243,692 |
276,661 |
| |
|
|
|
| Entered tonnage (GT) in millions |
2014 |
2015 |
2016 |
| Owned / Mutual |
59.2 |
68.5 |
72.1 |
| Chartered / Fixed |
17.8 |
22.5 |
28.0 |
| Total |
77.0 |
91.0 |
100.1 |
| |
|
|
|
| S&P Rating History |
2014 |
2015 |
2016 |
| |
BBB |
BBB+ |
BBB+ |
| |
|
|
|
| Average Expense Ratio (AER) |
2013/14 |
2014/15 |
2015/16 |
| Five years ending 20 February |
14.24 |
14.86 |
15.5 |