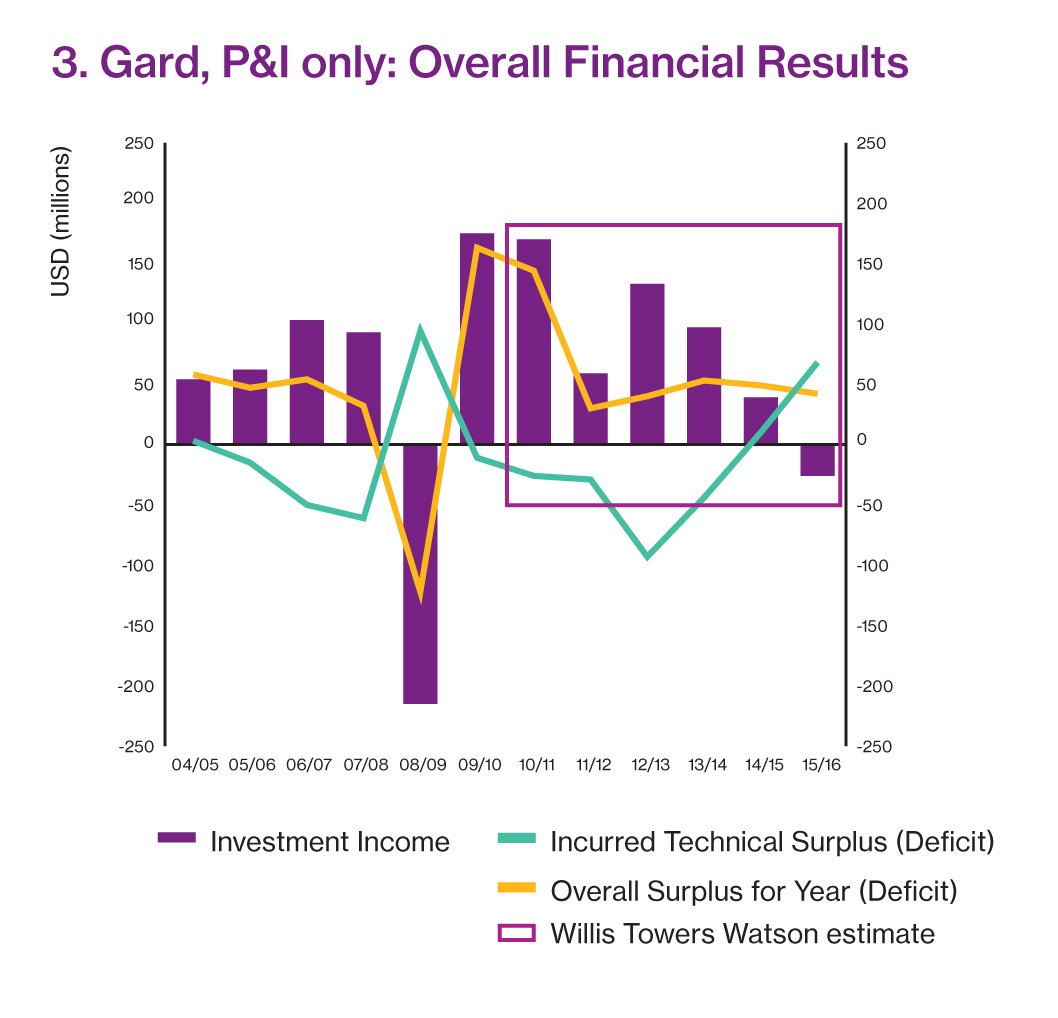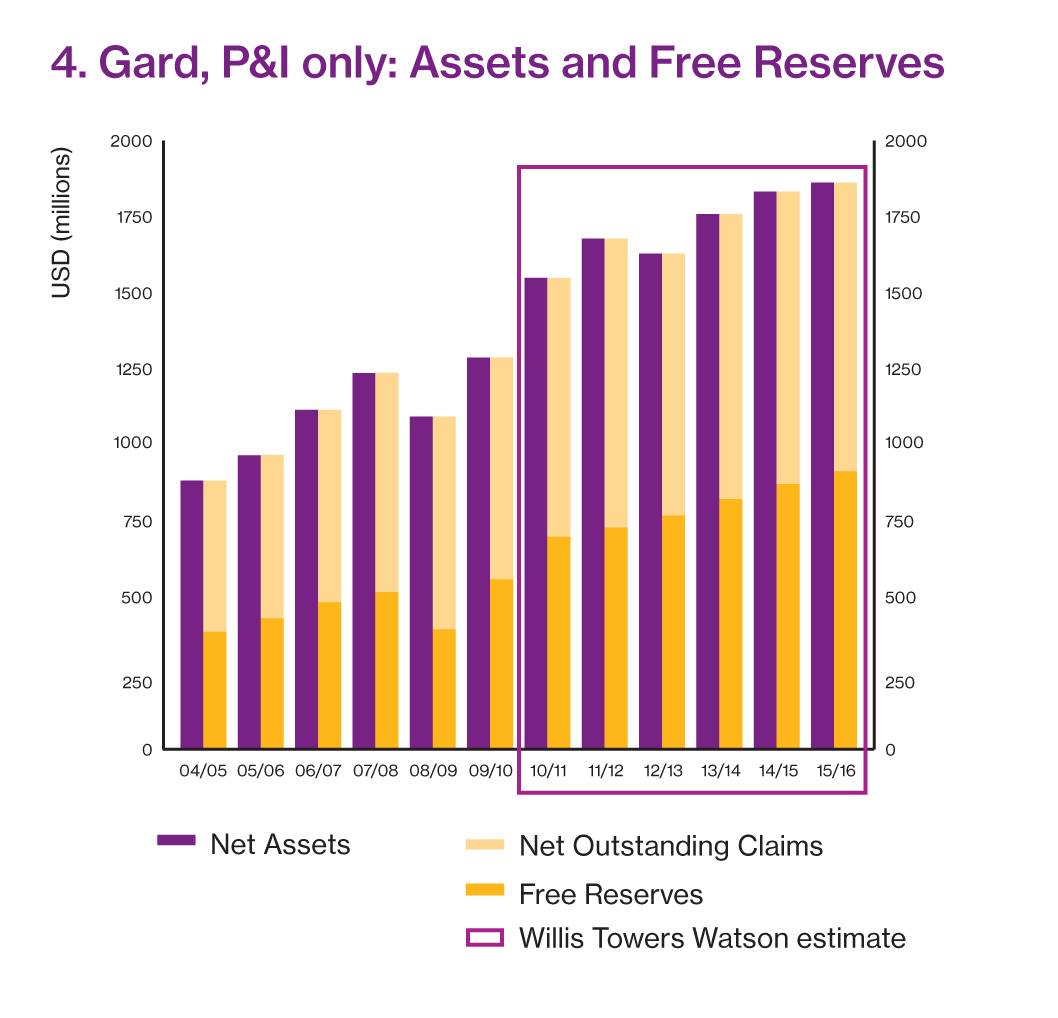
NB Gard's basis of disclosure: Gard changed their basis of reporting the P&I class of cover in 2010/11. Gard P&I underwriting results continue to be partially provided, but the club has progressively reduced the amount of information disclosed. Gard currently only publish the combined Gard Group results for net paid claims, net change in the provision for claims, investment return, assets and free reserves (i.e. the combined results for P&I, Marine and Energy). In the table above we show the Gard P&I class underwriting results to the fullest extent disclosed. We therefore use Gard 'Group' figures for assets and free reserves.To provide a meaningful comparison, the figures used in the financial graphs opposite represent Willis analysts' estimates of solely the P&I proportion Gard's investment income, assets and free reserves.
| Gard P&I Only Income and Expenditure Summary: | 2013/14 | 2014/15 | 2015/16 |
|---|---|---|---|
| Income and Expenditure | |||
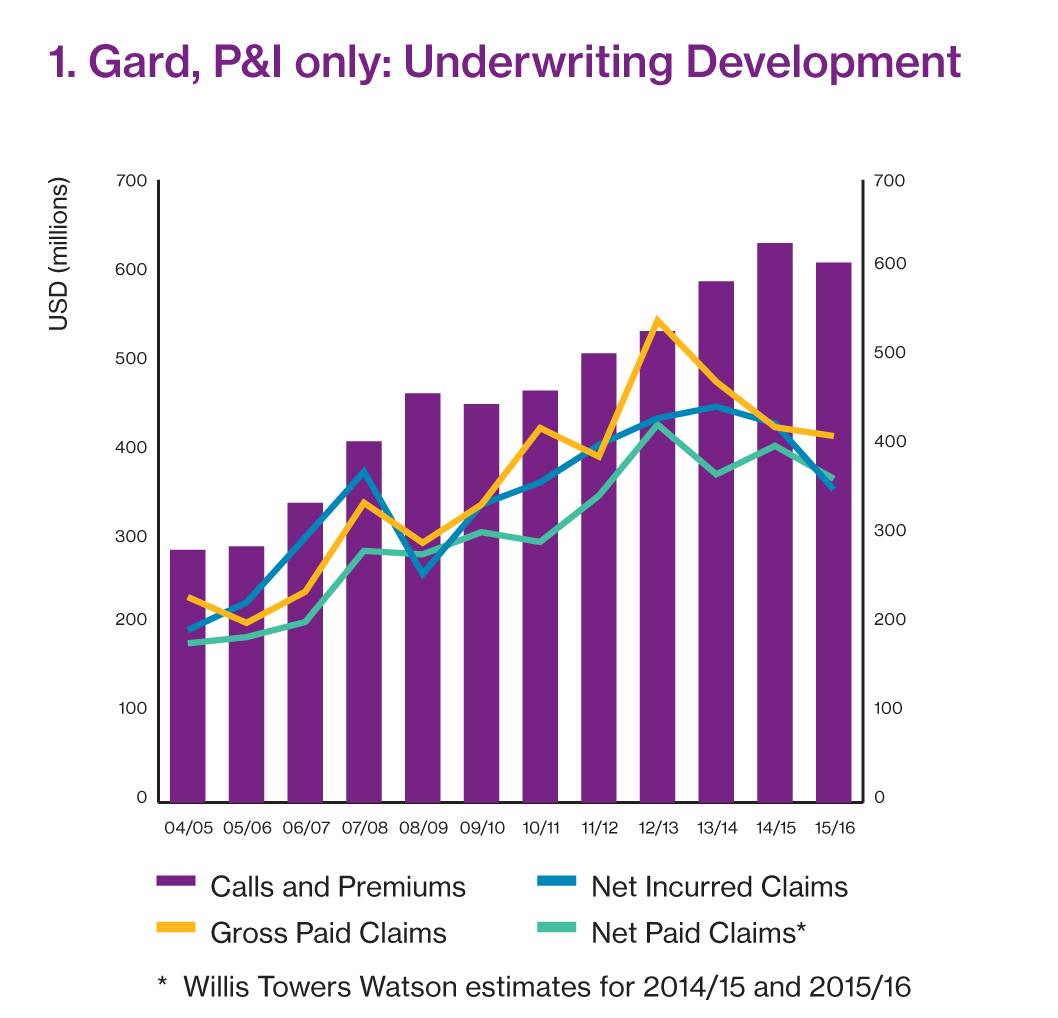
| Calls and Premiums | 585,606 | 628,672 | 607,260 |
| Reinsurance Premiums | -141,308 | -132,615 | -137,214 |
| Operating Expenses | -43,396 | -59,723 | -50,494 |
| Operating Income | 400,902 | 436,334 | 419,552 |
| Gross Paid Claims | 473,454 | 422,066 | 411,716 |
| Net Paid Claims | 369,369 | n/a | n/a |
| Net Change in Provision for Claims | 75,277 | n/a | n/a |
| Net Incurred Claims | 444,646 | 425,970 | 351,938 |
| Technical Surplus (Deficit) | -43,744 | 10,364 | 67,614 |
| Investment Income | n/a | n/a | n/a |
| Overall Surplus for Year (Deficit) | n/a | n/a | n/a |
| Gard Group Balance Sheet Summary: | |||
| Balance Sheet | |||
| Net Assets | 2,159,982 | 2,219,473 | 2,261,946 |
| Net Outstanding Claims | 1,215,860 | 1,250,883 | 1,245,249 |
| Free Reserves | 944,122 | 968,590 | 1,016,697 |
| Entered tonnage (GT) in millions | 2014 | 2015 | 2016 |
| Owned / Mutual | 169.8 | 188.7 | 198.8 |
| Owned Mobile Offshore Units / Fixed | 16.9 | 18.9 | 16.4 |
| Chartered / Fixed | 57.5 | 57.5 | 90.0 |
| Total | 244.2 | 265.1 | 305.2 |
| S&P Rating History | 2014 | 2015 | 2016 |
| A+ | A+ | A+ | |
| Average Expense Ratio (AER) | 2014 | 2015 | 2016 |
| Five years ending 20 February | 11.3 | 11.4 | 11.8 |