North acquired the Sunderland Marine on 28 February 2014
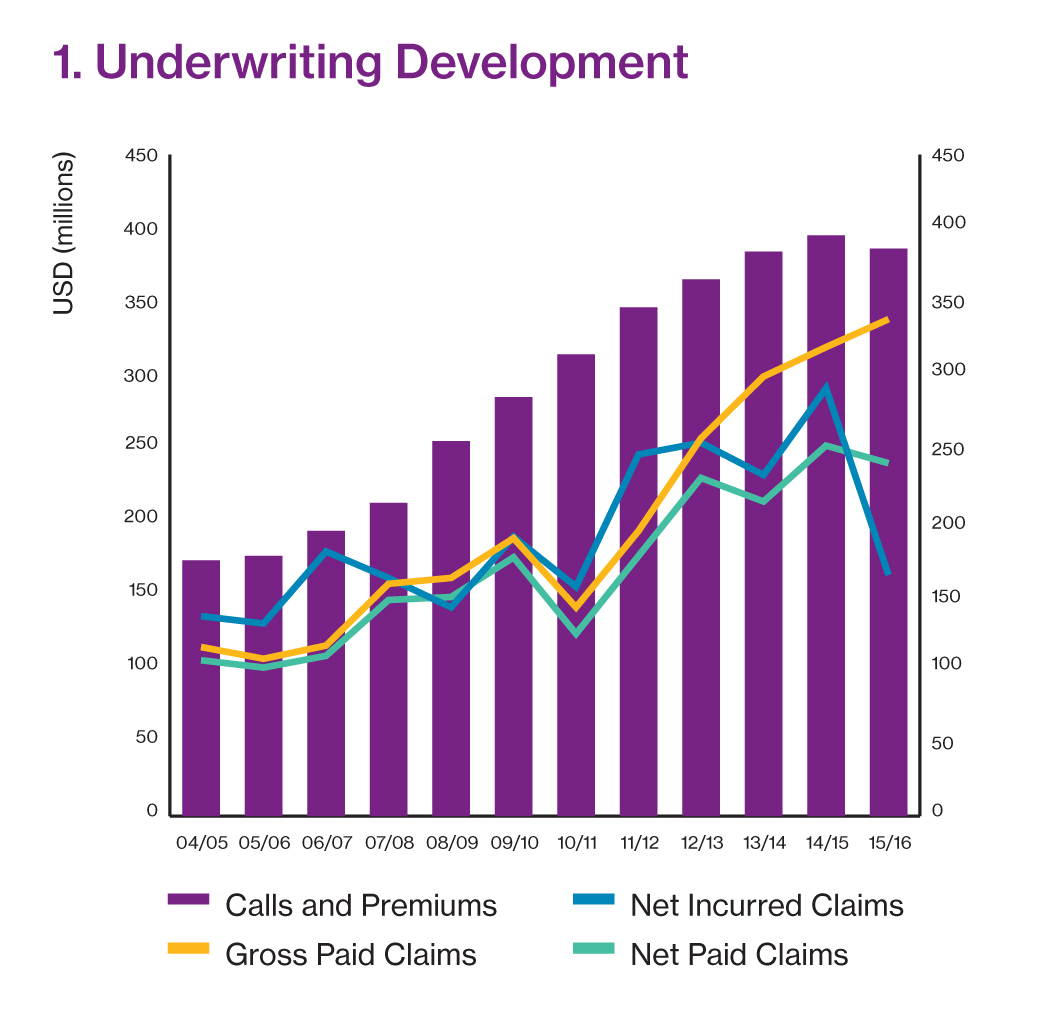
The table and graphs show the income, expenditure and balance sheet results for North only
North 'only' highlights
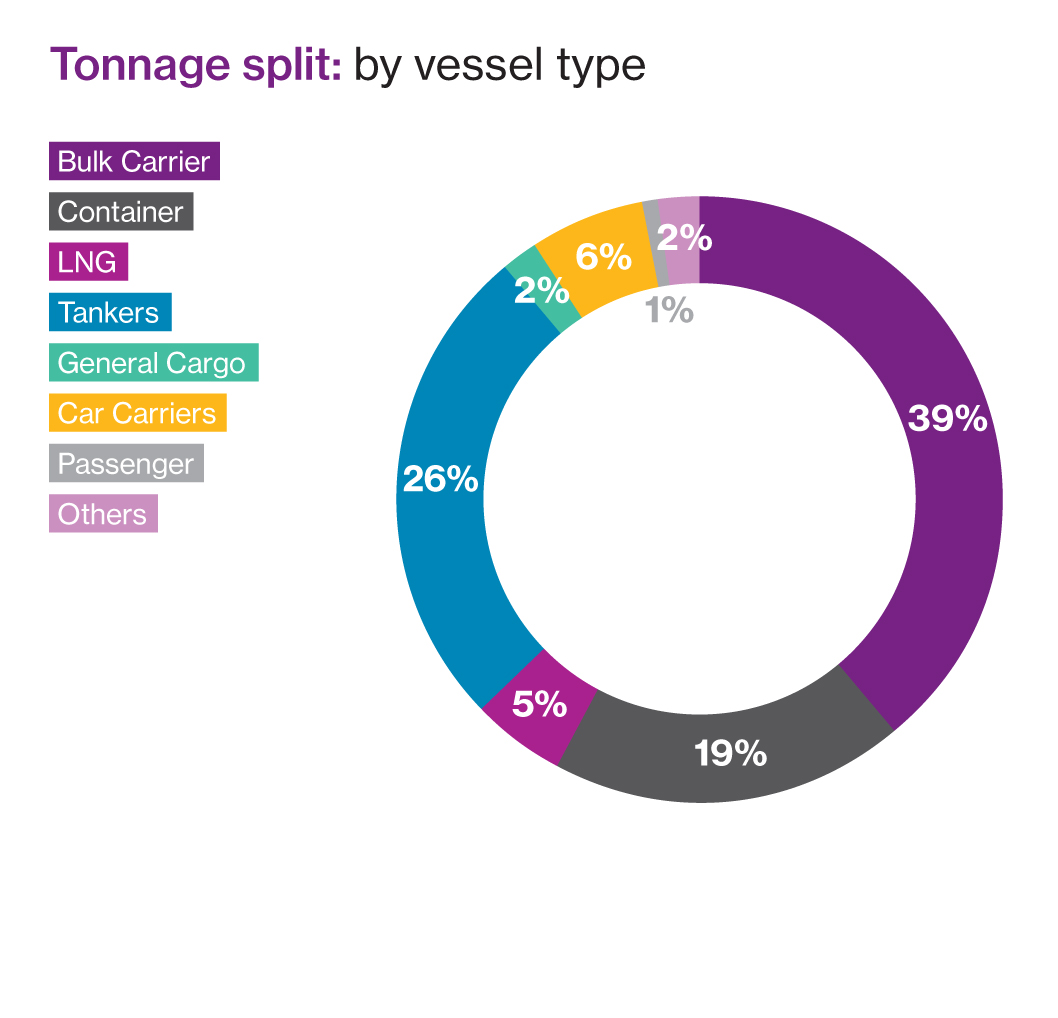
Owned tonnage increased by 3.2%
Premiums reduced by 2.3%
Gross paid claims increased by 5.9%, net paid claims reduced by 4.9%
Estimates for outstanding claims reduced by USD 76 million
Huge, 43.6% reduction in total net incurred claims
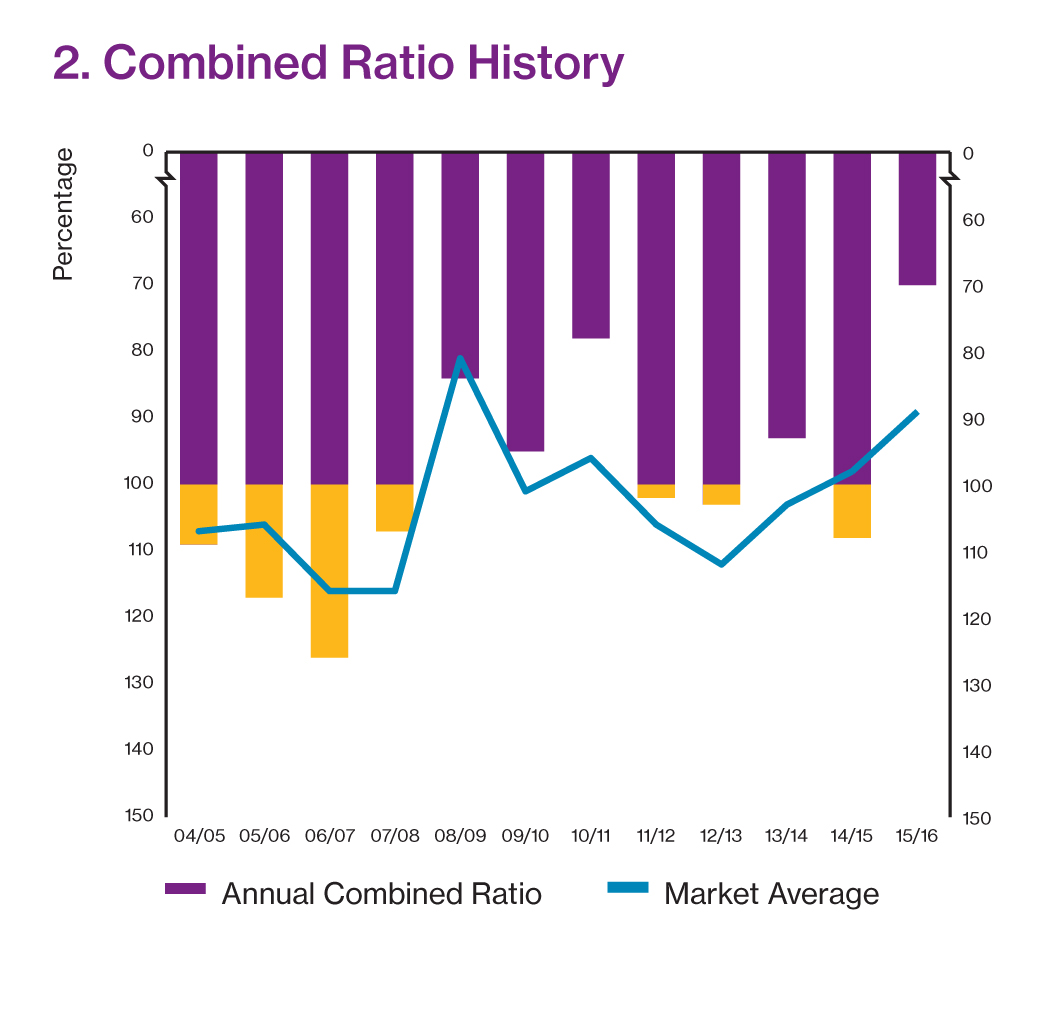
Complete transformation in the underwriting result; from a USD 24.4 million deficit in 2014/15 to a USD 95.2 million surplus in 2015/16
In combined ratio terms, an improvement from 108% to 69% in a single year
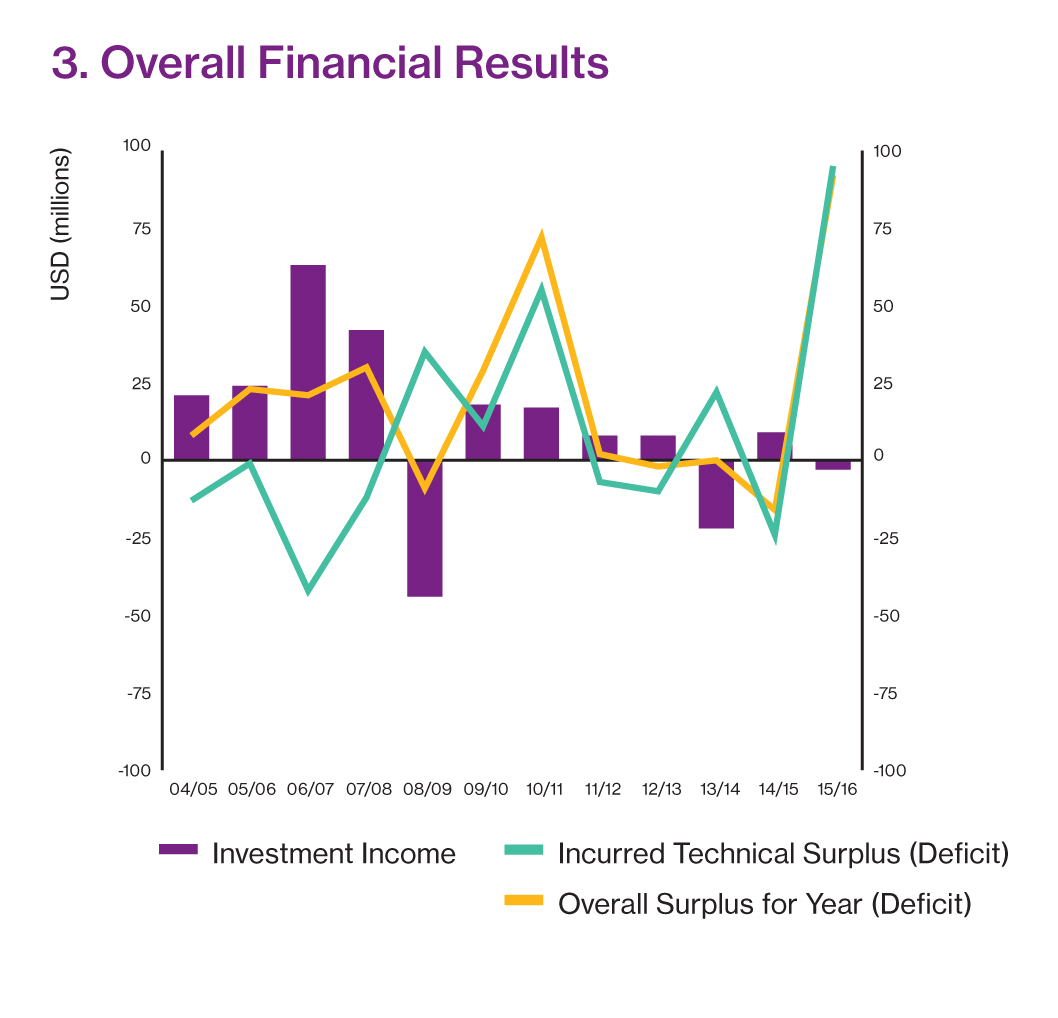
Overall group investment loss approximately -1.2%
USD 92 million overall surplus for the year
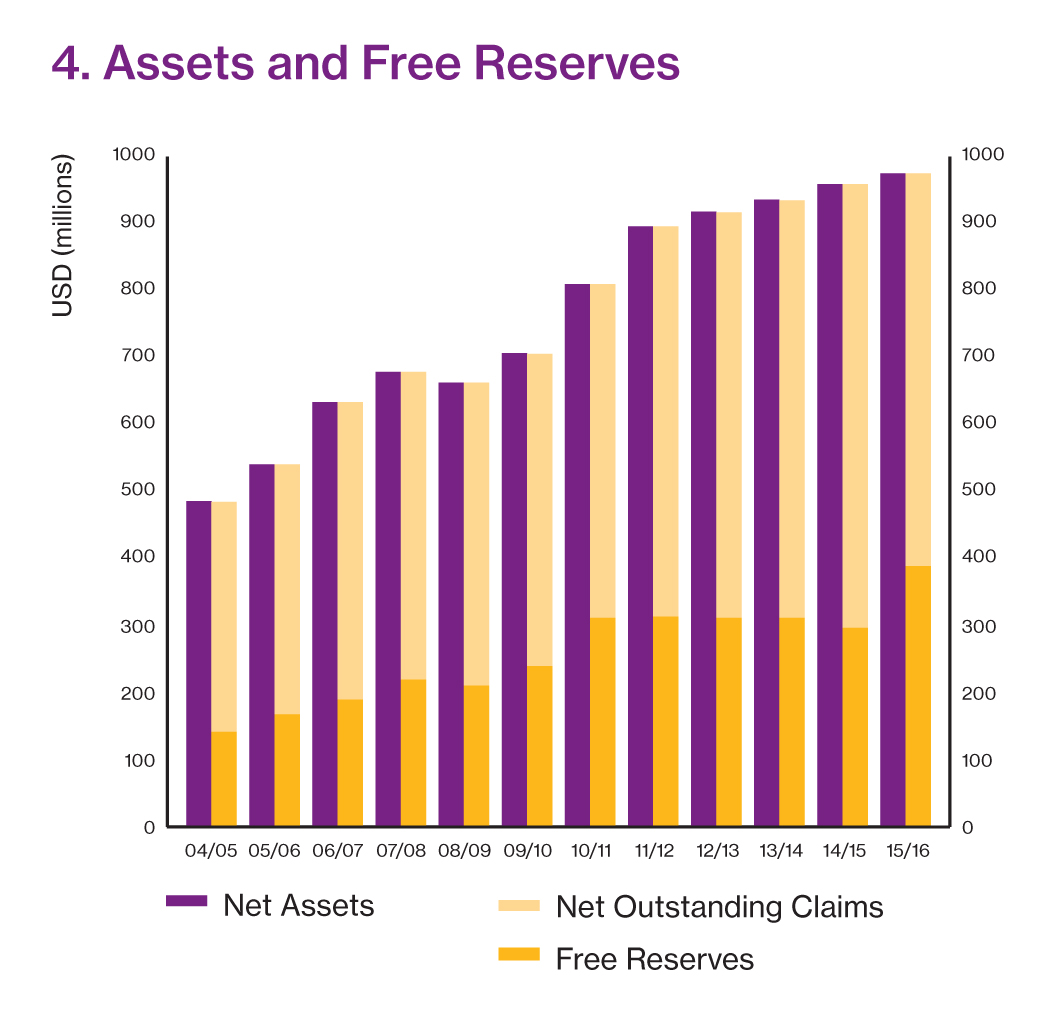
Assets increased by 1.7%, free reserves increased by 31%
Highlights of the combined results for the merged North / Sunderland Marine group
At 28 February 2014, the point of merger, Sunderland Marine contributed USD 41.4 million to the free reserves of North (i.e. creating combined Group free reserves of USD 338.1 million)
The Group's free reserves increased to USD 428.1 million at 20 February 2016 (an increase of 26.7%)
The Sunderland Marine's technical results were also very positive in 2015/16, though not quite as spectacular as North. The Group combined ratio for 2015/16 being 73.3%