American Club | www.american-club.com
2015/16 financial year results
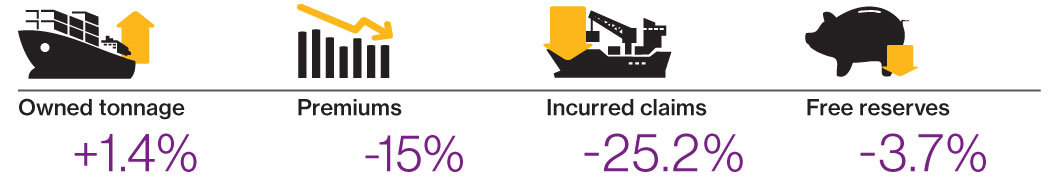
- Owned tonnage increased by 1.4%
- Premiums reduced by 15%
- Reinsurance premiums reduced by 21.5%
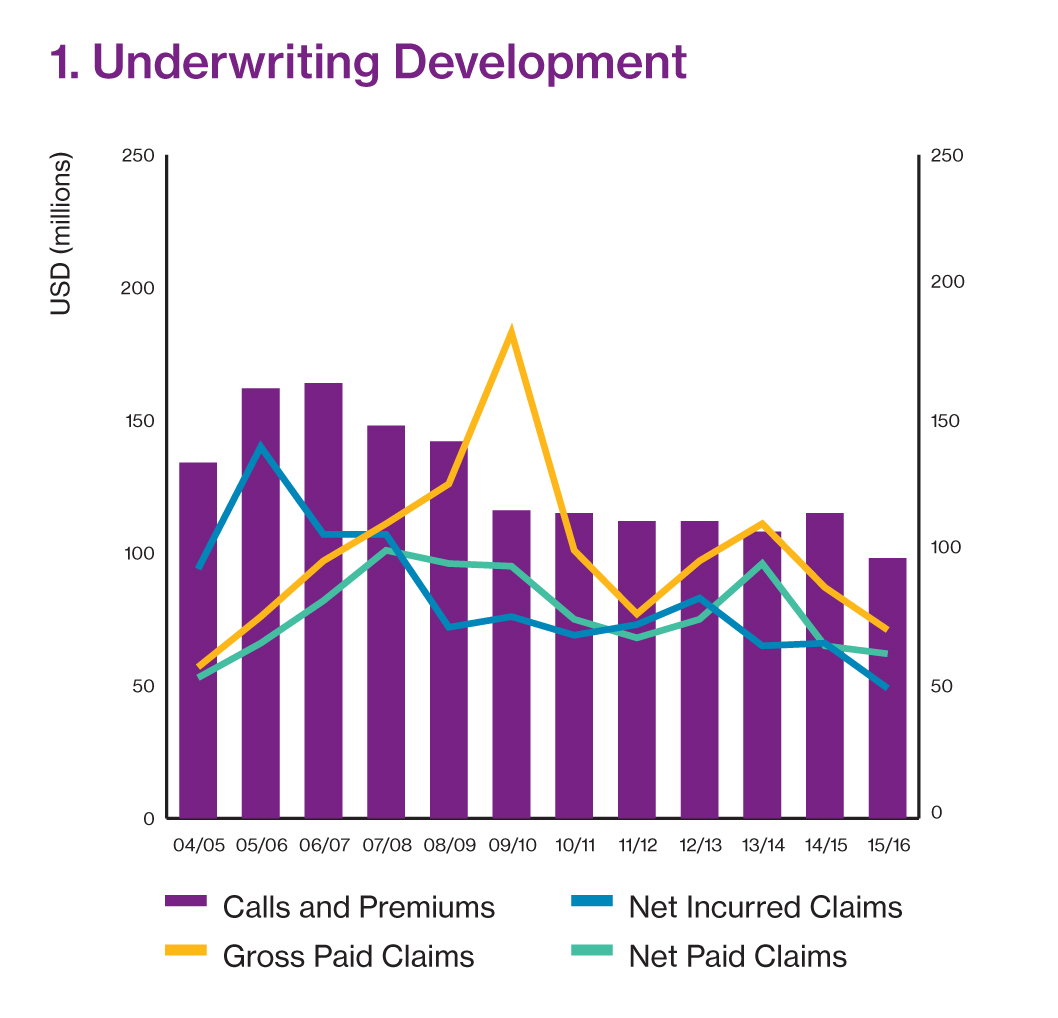
- Gross and net paid claims reduced by 18.2% and 4.7% respectively
- Net incurred claims reduced by 25.2%
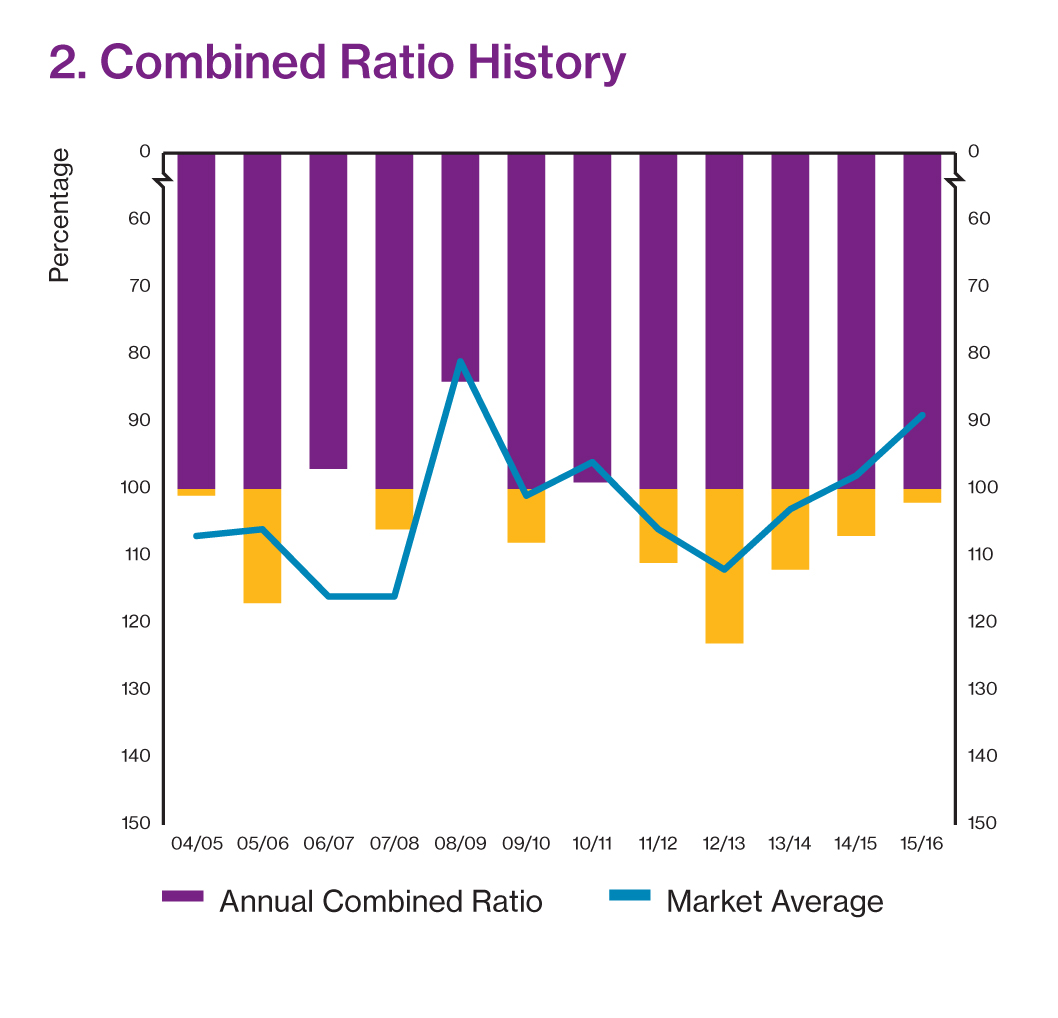
- Improved underwriting loss (improved from a USD 6.5 m deficit in 2014/15 to a USD 2 m deficit in 2015/16)
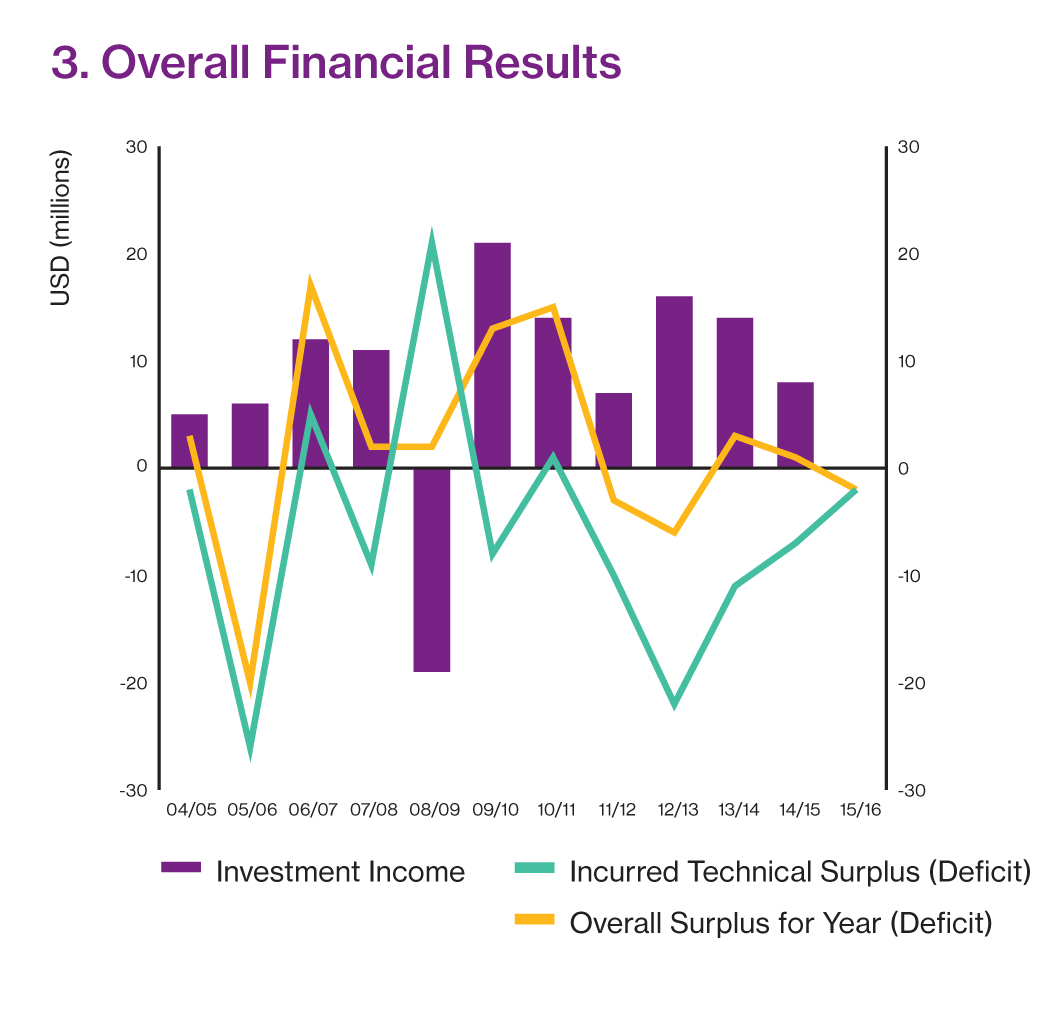
- Essentially a 'stand still' investment result
- Marginal overall deficit for the year (USD -2.2 m)
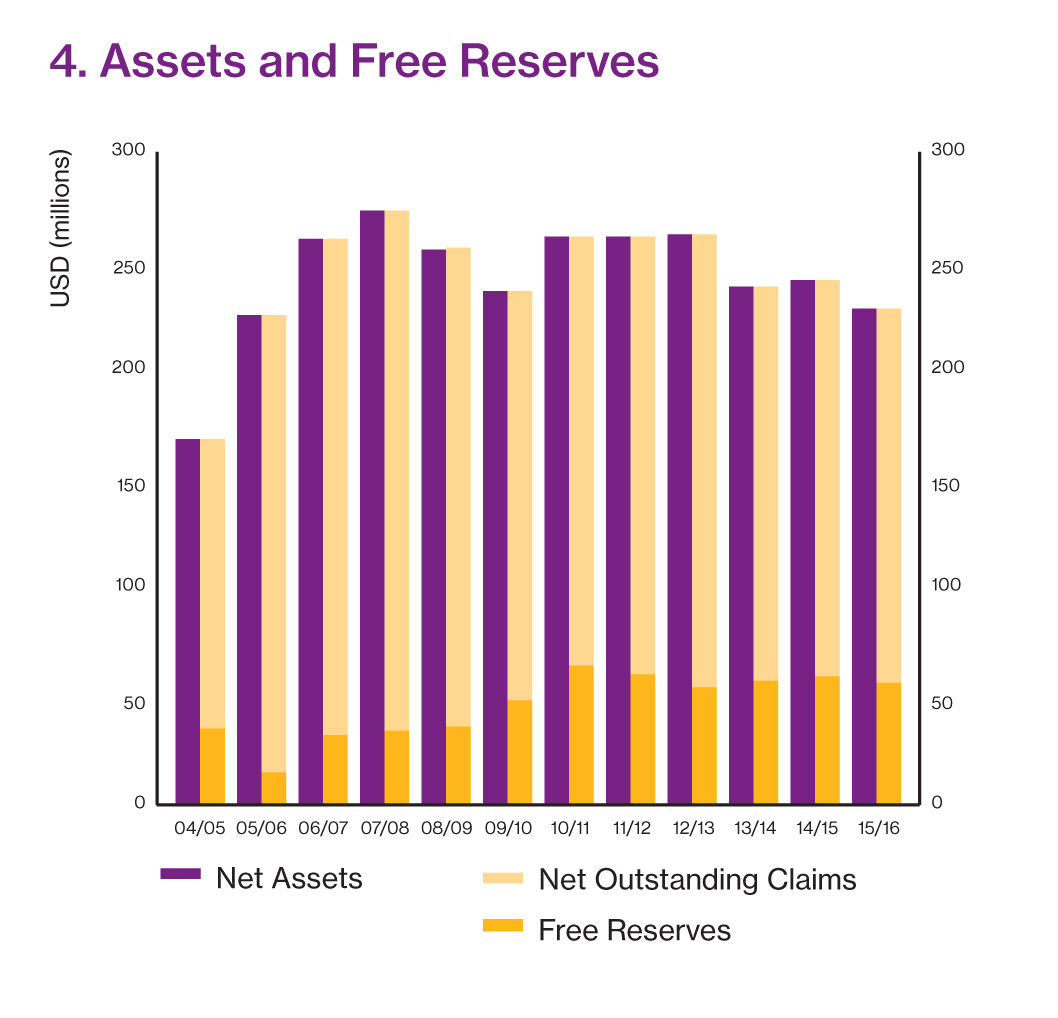
- Assets and free reserves reduced by 5.3% and 3.7% respectively
Consolidated Financial Year Summary (USD 000s)
|
2013/14 |
2014/15 |
2015/16 |
| Income and Expenditure |
|
|
|
| Calls and Premiums |
107,959 |
114,798 |
97,504 |
| Reinsurance Premiums |
-18,581 |
-20,553 |
-16,128 |
| Operating Expenses |
-35,250 |
-34,795 |
-33,978 |
| Operating Income |
54,128 |
59,450 |
47,398 |
| Gross Paid Claims |
110,932 |
87,418 |
71,465 |
| Net Paid Claims |
95,678 |
64,751 |
61,673 |
| Net Change in Provision for Claims |
-30,614 |
1,211 |
-12,309 |
| Net Incurred Claims |
65,064 |
65,962 |
49,364 |
| Technical Surplus (Deficit) |
-10,936 |
-6,512 |
-1,966 |
| Investment Income |
14,051 |
7,768 |
-224 |
| Overall Surplus for Year (Deficit) |
3,115 |
1,256 |
-2,190 |
| |
|
|
|
| Balance sheet |
|
|
|
| Net Assets |
238,478 |
241,098 |
228,278 |
| Net Outstanding Claims |
181,134 |
182,498 |
171,868 |
| Free Reserves |
57,344 |
58,600 |
56,410 |
| |
|
|
|
| Entered tonnage (GT) in millions |
2014 |
2015 |
2016 |
| Owned / Mutual |
16.7 |
13.9 |
14.1 |
| Chartered / Fixed |
1.0 |
1.1 |
1.1 |
| Total |
17.7 |
15.0 |
15.2 |
| |
|
|
|
| S&P Rating History |
2014 |
2015 |
2016 |
| |
BBB- |
BBB- |
BBB- |
| |
|
|
|
| Average Expense Ratio (AER) |
2013/14 |
2014/15 |
2015/16 |
| Five years ending 20 February
|
19.3 |
21.6 |
24.2 |