Reinsurance and Pooling costs represent approximately 40% of average P&I premiums paid by ship operators (although in some sectors the fixed costs can account for in excess of 85% of premiums).
This section outlines the results of the International Group (IG) Reinsurance renewal negotiations at 20 February 2017. It also discusses the trends in Pool claims (and very large claims generally).
For future consideration we again include a suggestion regarding a potential change to the cost allocation system that would smooth out the impact of major catastrophes on the distribution of reinsurance costs to different ship types.
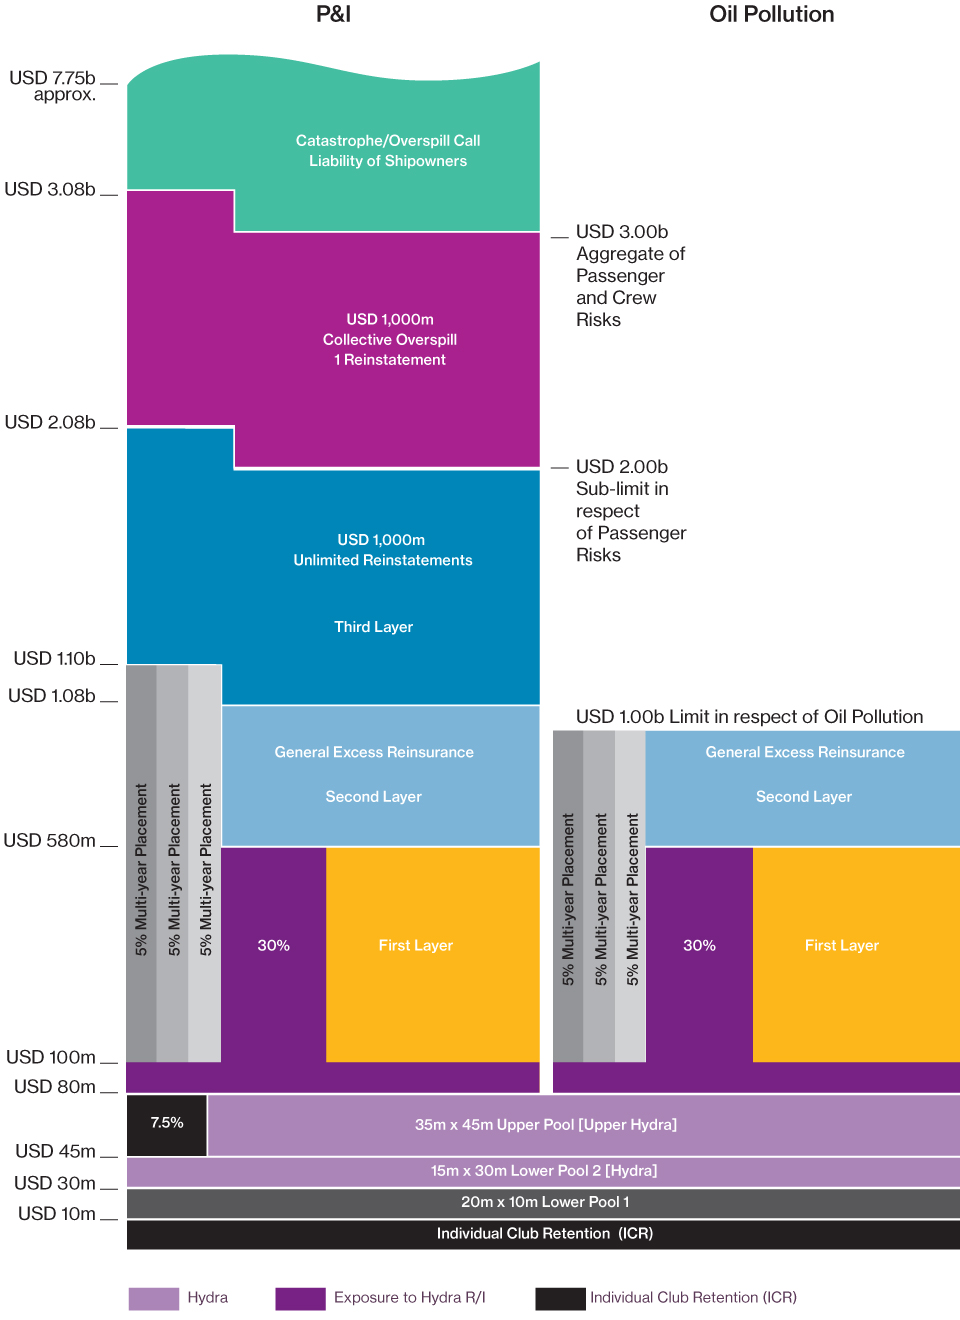
The 2017 structure of the IG Reinsurance programme will be as per the structure chart.
International Group Reinsurance Structure Anticipated for the 2017 Policy Year
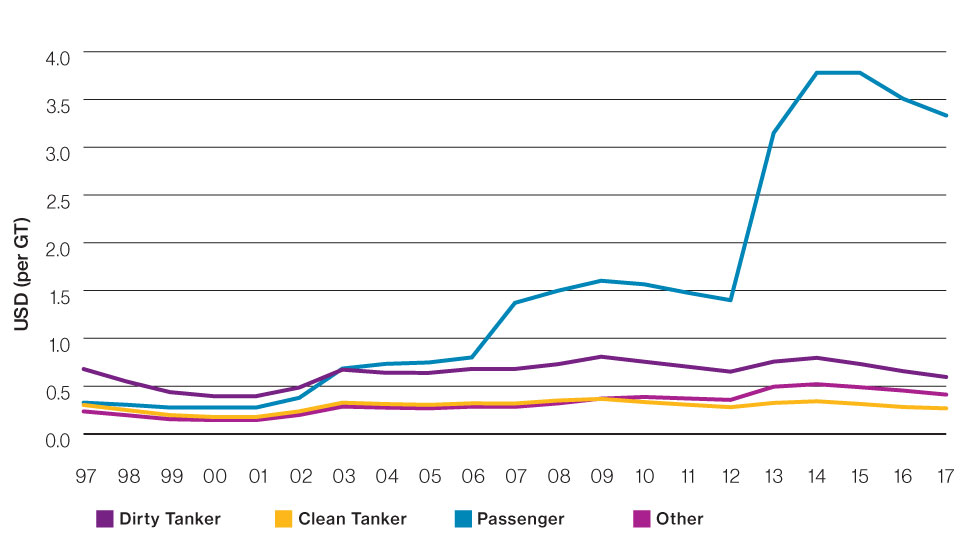
The long term trend in the IG reinsurance rates is also shown in the IG reinsurance cost progression graph.
IG Reinsurance, Cost Changes by Vessel Type
| Vessel Type | 2016/17 (USD, per GT, per annum) |
2017/18 (USD, per GT, per annum) |
Decrease (USD, per GT, per annum) |
Percentage Decrease |
|---|---|---|---|---|
| Dirty tanker | 0.6567 | 0.5955 | -0.0612 | -9.31% |
| Clean tanker | 0.2816 | 0.2675 | -0.0141 | -5.0% |
| Dry / other | 0.4537 | 0.4114 | -0.0423 | -9.3% |
| Passenger | 3.5073 | 3.3319 | -0.1754 | -5.0% |