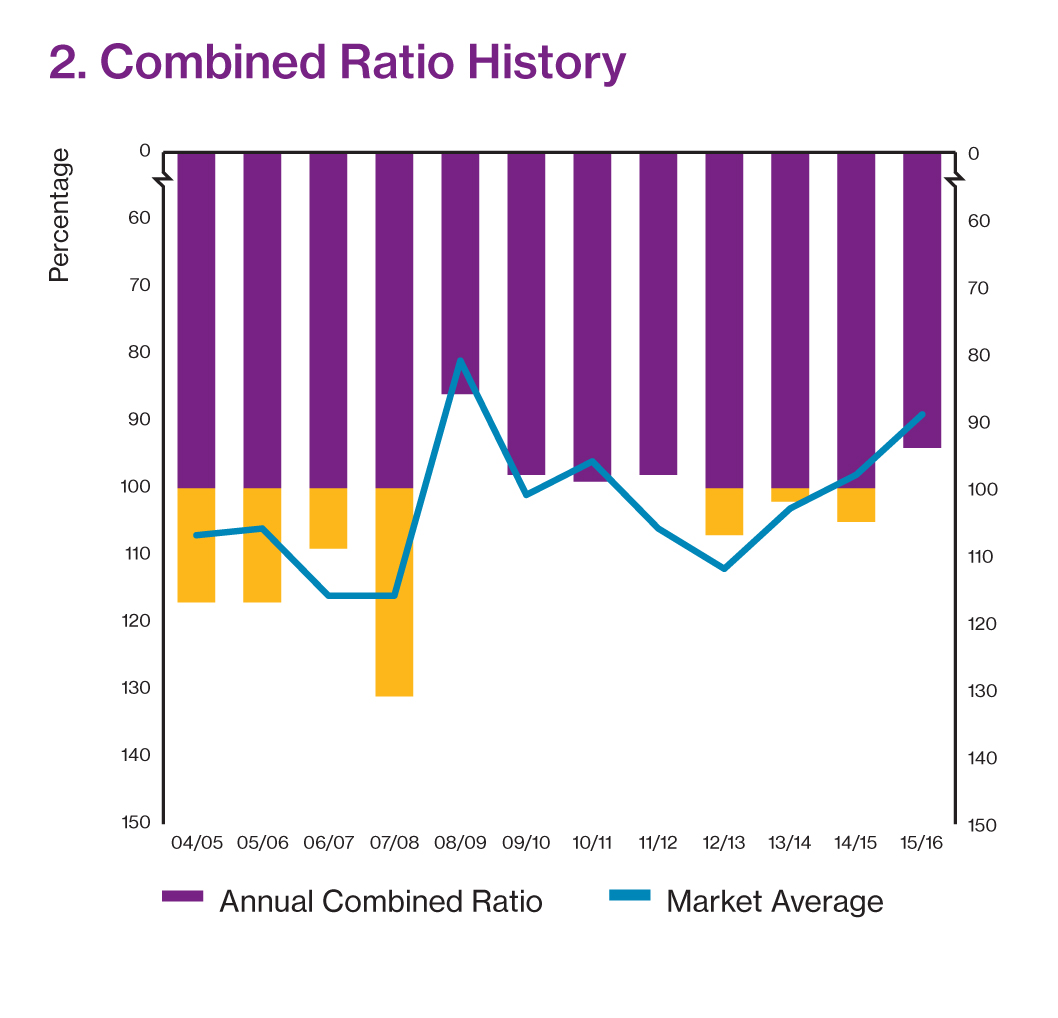
The UK Club's accounts treat foreign exchange differently to most of the other clubs. The most common approach is to report the foreign exchange movement on outstanding claims within the claims cost heading, and the exchange movement relating to investments within the investment return. The UK Club's approach is to include all foreign exchange movements in a single item under foreign exchange. This accounting difference results in the UK Club's investment return appearing higher than others and the underwriting result not as positive as their peers. In 2015/16, if the UK Club had reported in a similar way to the majority of the market, the club's combined ratio would have been 87.4% rather than 91.6%.
| 2013/14 | 2014/15 | 2015/16 | |
|---|---|---|---|
| Income and Expenditure | |||
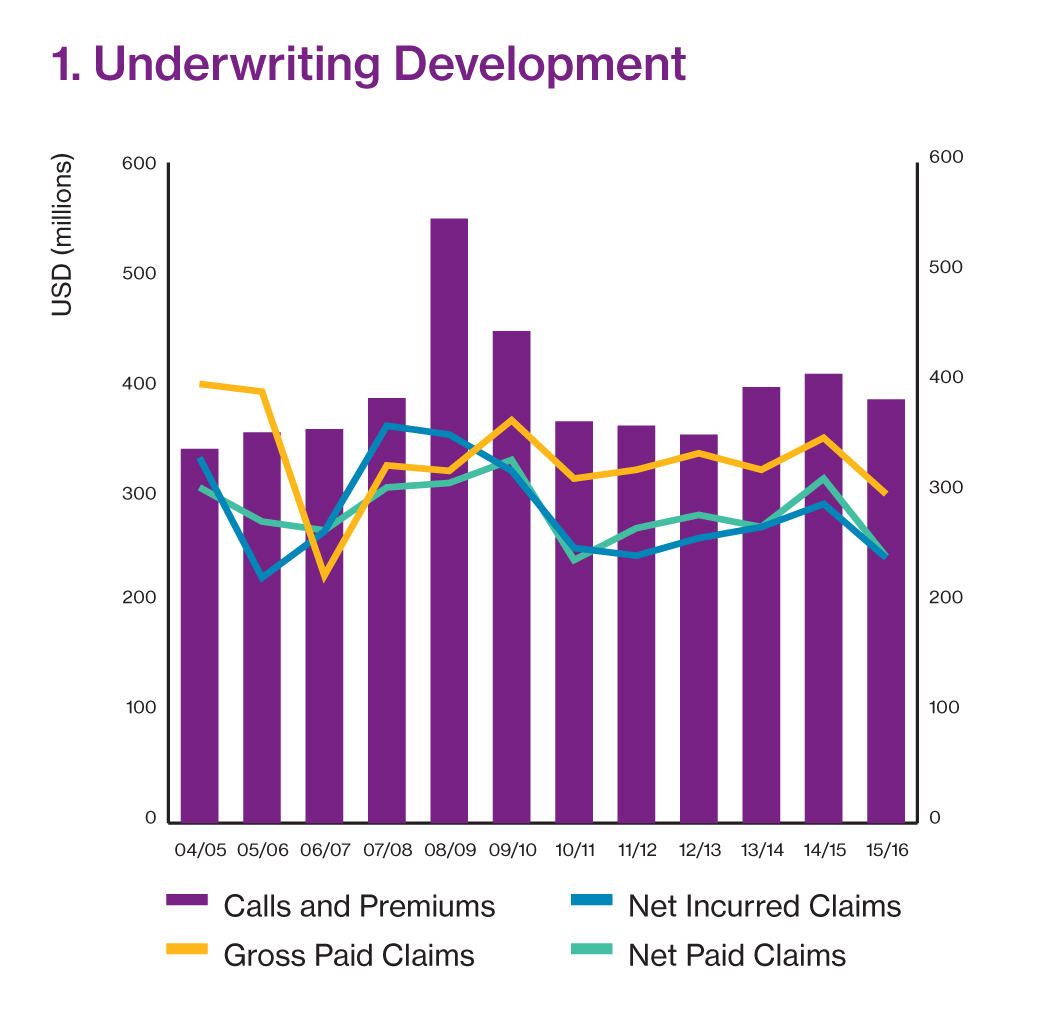
| Calls and Premiums | 396,281 | 408,059 | 385,360 |
| Reinsurance Premiums | -93,502 | -88,969 | -81,414 |
| Operating Expenses | -40,942 | -43,961 | -44,874 |
| Operating Income | 261,837 | 275,129 | 259,072 |
| Gross Paid Claims | 320,549 | 349,693 | 299,461 |
| Net Paid Claims | 269,021 | 313,480 | 241,989 |
| Net Change in Provision for Claims | -115 | -23,544 | -737 |
| Net Incurred Claims | 268,906 | 289,936 | 241,252 |
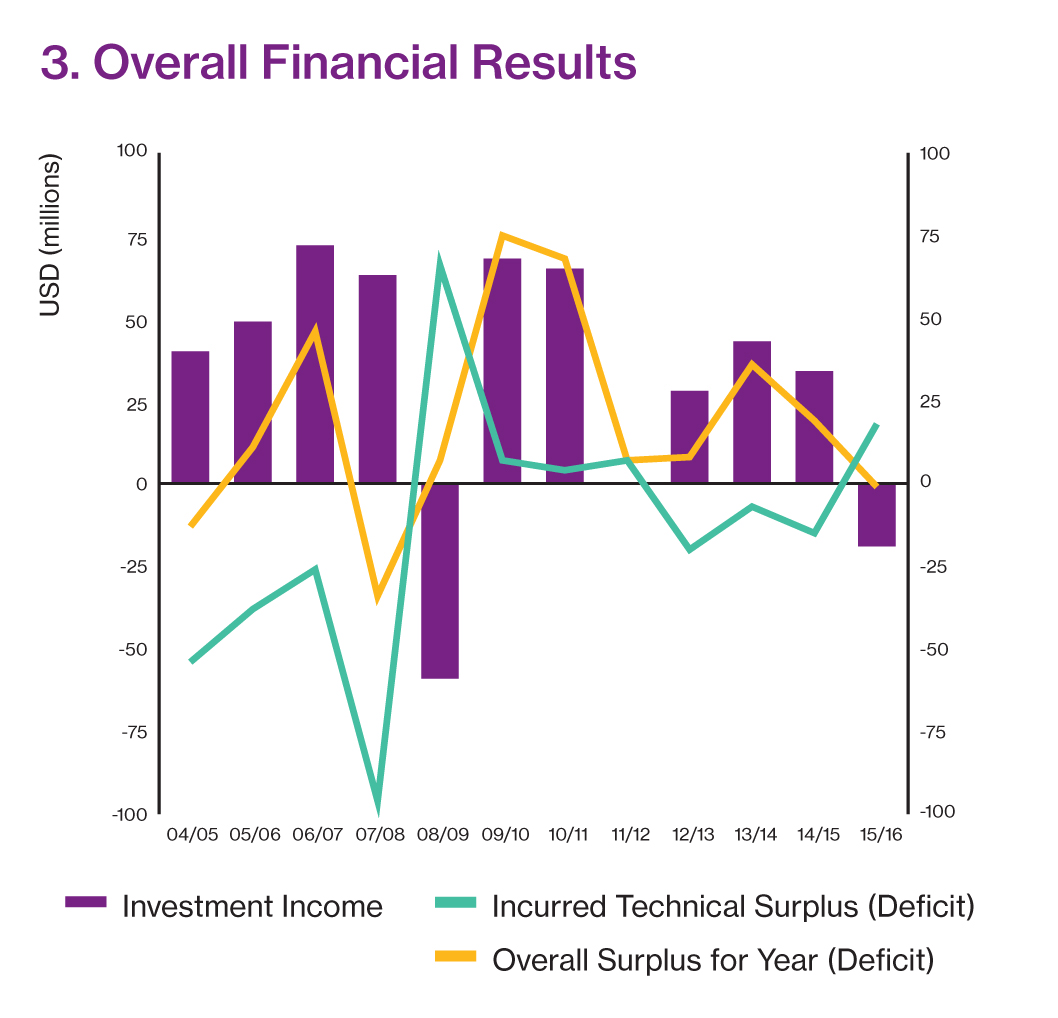
| Technical Surplus (Deficit) | -7,069 | -14,807 | 17,820 |
| Investment Income | 43,017 | 33,872 | -19,045 |
| Overall Surplus for Year (Deficit) | 35,948 | 19,065 | -1,225 |
| Balance sheet | |||
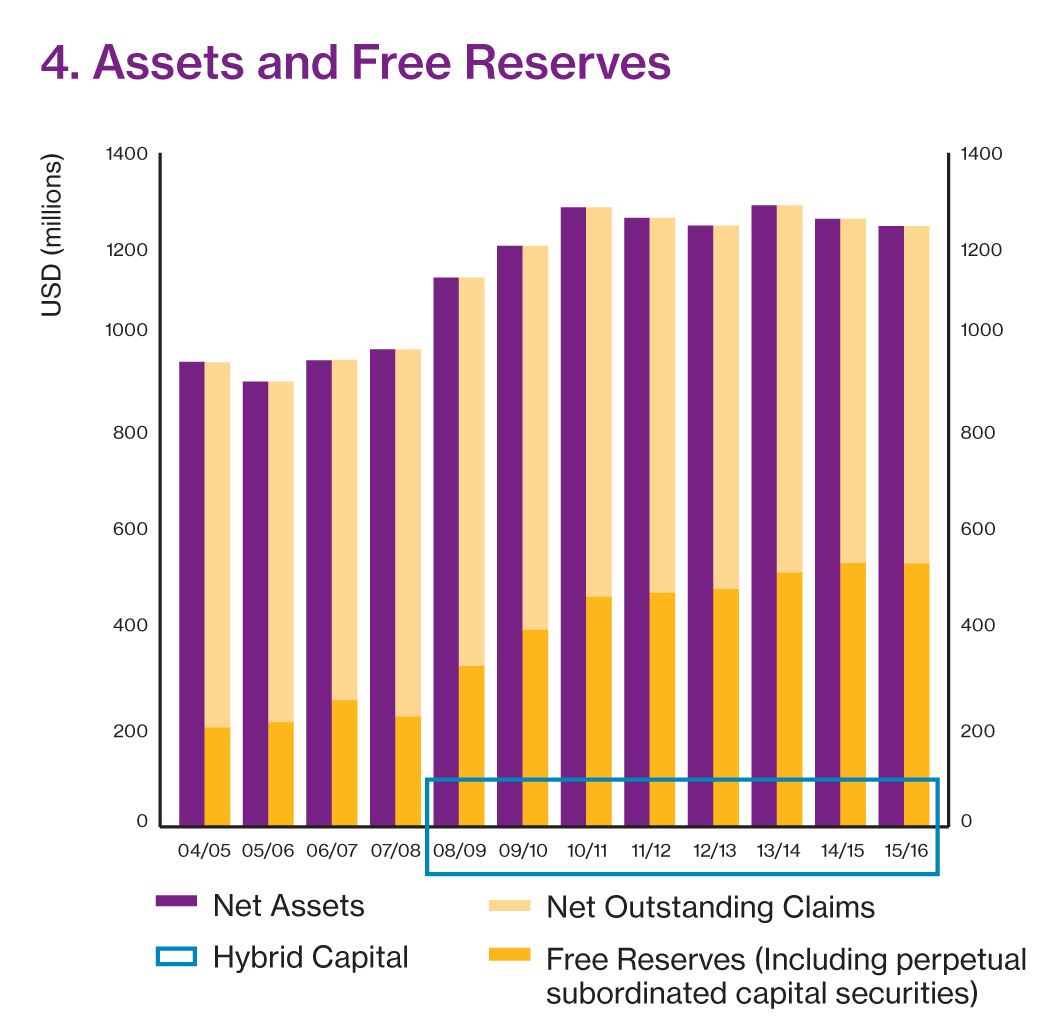
| Net Assets | 1,291,115 | 1,262,845 | 1,248,255 |
| Net Outstanding Claims | 762,773 | 715,079 | 701,342 |
| Free Reserves | 528,342 | 547,766 | 546,913 |
| Hybrid Capital | 2013/14 | 2014/15 | 2015/16 |
| The above figures include the contribution of the UK P&I Club's perpetual subordinated capital (hybrid capital). The amounts included relating to this perpetual subordinated capital are as follows: | |||
| Interest on Hybrid Capital (in investment income) | 8,250 | 7,500 | 7,500 |
| Assets of Hybrid Capital | 98,338 | 98,697 | 99,069 |
| Entered tonnage (GT) in millions | 2014 | 2015 | 2016 |
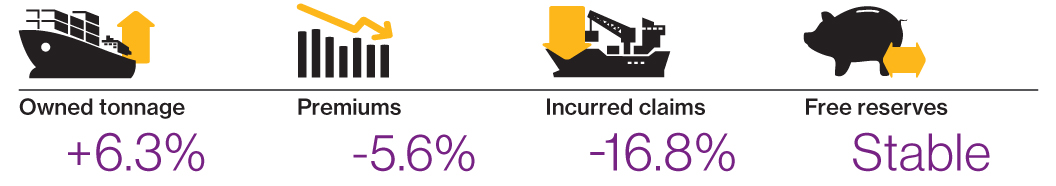
| Owned / Mutual | 124 | 127 | 135 |
| Chartered / Fixed | 94 | 98 | 98 |
| Total | 218 | 225 | 233 |
| S&P Rating History | 2014 | 2015 | 2016 |
| A | A | A | |
| Average Expense Ratio (AER) | 2013/14 | 2014/15 | 2015/16 |
| Five years ending 20 February | 9.35 | 9.66 | 10.17 |