Steamship | www.simsl.com
2015/16 financial year results
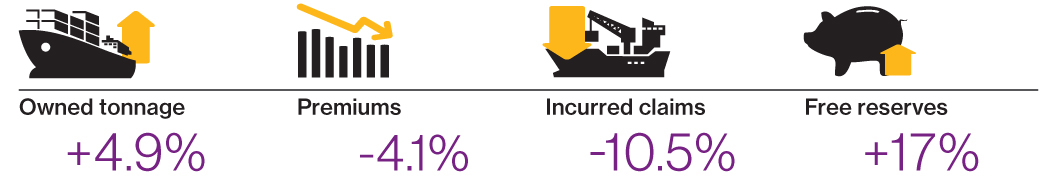
- Owned tonnage increased by 4.9%
- Premiums reduced by 4.1%
- Reinsurance costs and operating expenses reduced by 6.1% and 8.9% respectively
- Gross and net paid claims reduced by 36.6% and 6.7% respectively
- 5.9% reduction in estimates for outstanding claims
- Total net incurred claims reduced by 10.5%
- Increased underwriting surplus, from USD 63.3 m in 2014/15 to USD 76.2 m in 2015/16
- Investment return almost break even (-0.1% return)
- Overall surplus USD 64 million
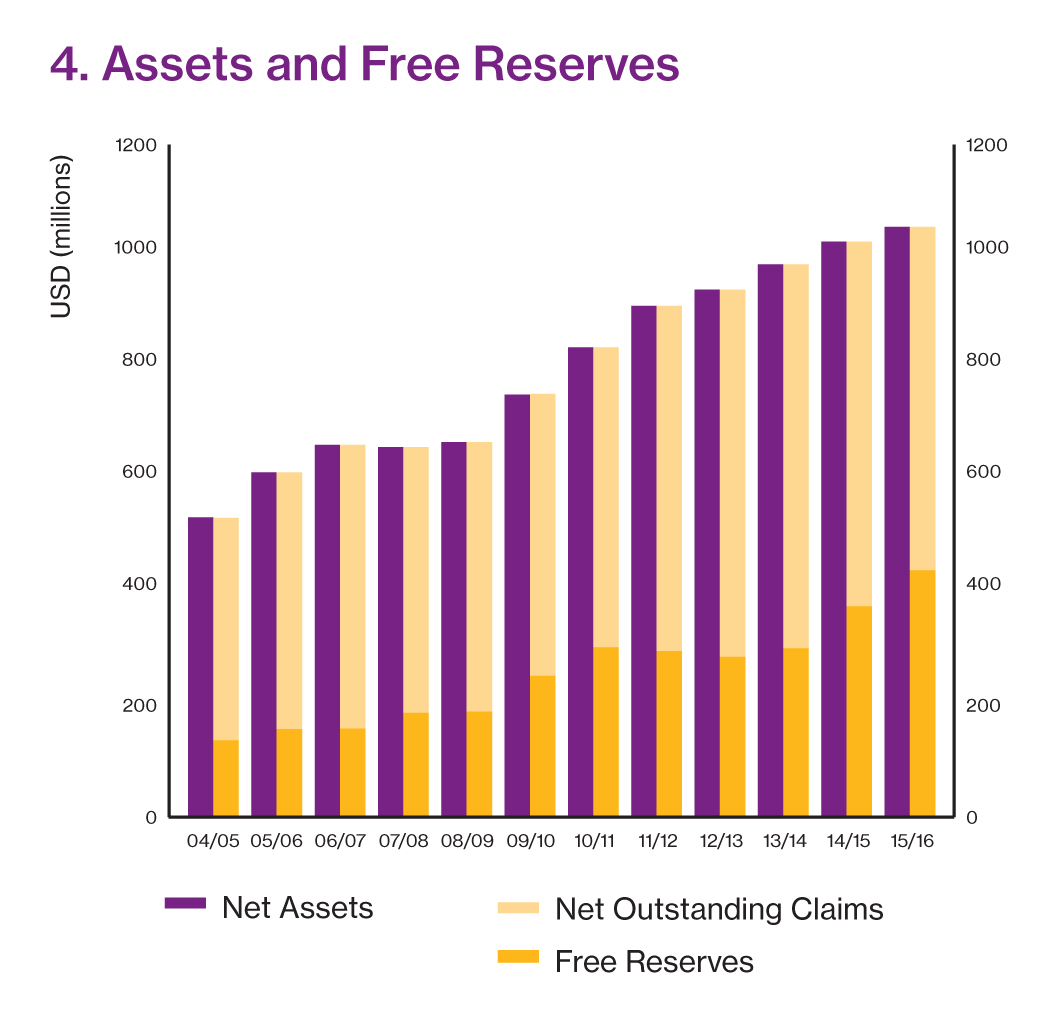
- Assets and free reserves increased by 2.5% and 17.0% respectively
Consolidated Financial Year Summary (USD 000s)
|
2013/14 |
2014/15 |
2015/16 |
| Income and Expenditure |
|
|
|
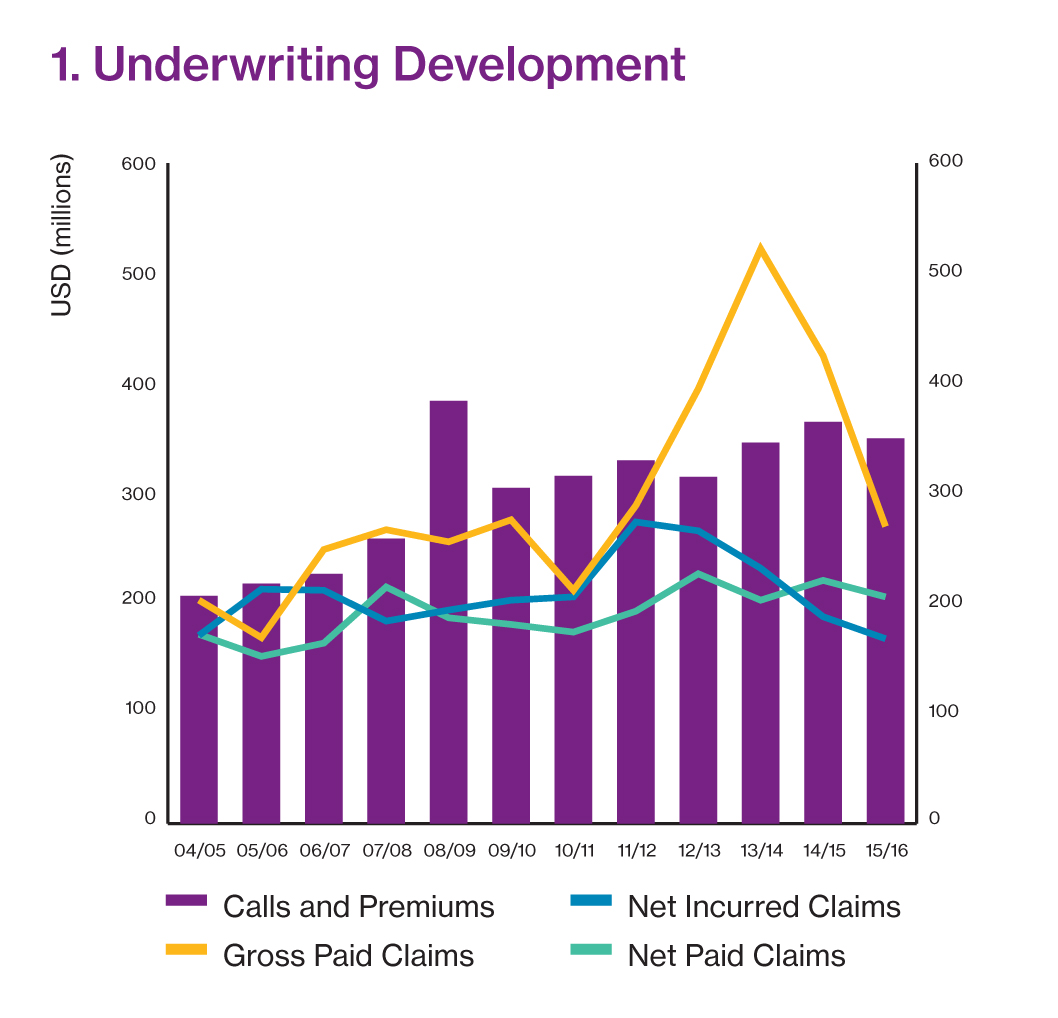
| Calls and Premiums |
345,731 |
365,341 |
350,329 |
| Reinsurance Premiums |
-61,169 |
-69,002 |
-64,830 |
| Operating Expenses |
-42,823 |
-45,421 |
-41,397 |
| Operating Income |
241,739 |
250,918 |
244,102 |
| Gross Paid Claims |
522,110 |
425,452 |
269,945 |
| Net Paid Claims |
203,159 |
220,943 |
206,081 |
| Net Change in Provision for Claims |
29,291 |
-33,329 |
-38,151 |
| Net Incurred Claims |
232,450 |
187,614 |
167,930 |
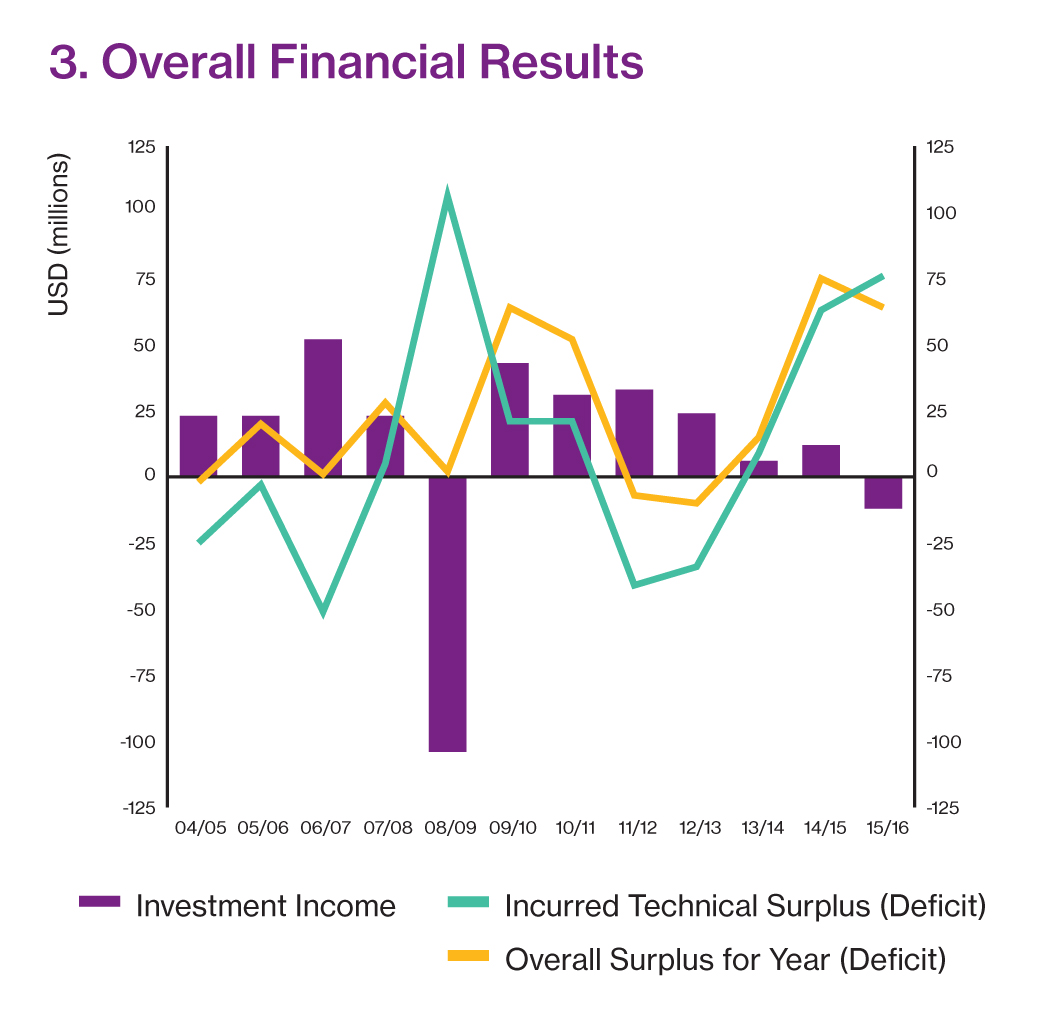
| Technical Surplus (Deficit) |
9,289 |
63,304 |
76,172 |
| Investment Income |
5,703 |
11,684 |
-12,038 |
| Overall Surplus for Year (Deficit) |
14,992 |
74,988 |
64,134 |
| |
|
|
|
| Balance sheet |
|
|
|
| Net Assets |
985,701 |
1,027,360 |
1,053,343 |
| Net Outstanding Claims |
684,502 |
651,173 |
613,022 |
| Free Reserves |
301,199 |
376,187 |
440,321 |
| |
|
|
|
| Entered tonnage (GT) in millions |
2014 |
2015 |
2016 |
| Owned / Mutual |
68.7 |
74.3 |
77.9 |
| Chartered / Fixed |
45 |
46 |
51.2 |
| Total |
113.7 |
120.3 |
129.1 |
| |
|
|
|
| S&P Rating History |
2014 |
2015 |
2016 |
| |
A- |
A- |
A- |
| |
|
|
|
| Average Expense Ratio (AER) |
2013/14 |
2014/15 |
2015/16 |
| Five years ending 20 February |
11.3 |
11.8 |
12.1 |