| 2013/14 | 2014/15 | 2015/16 | |
|---|---|---|---|
| Income and Expenditure | |||
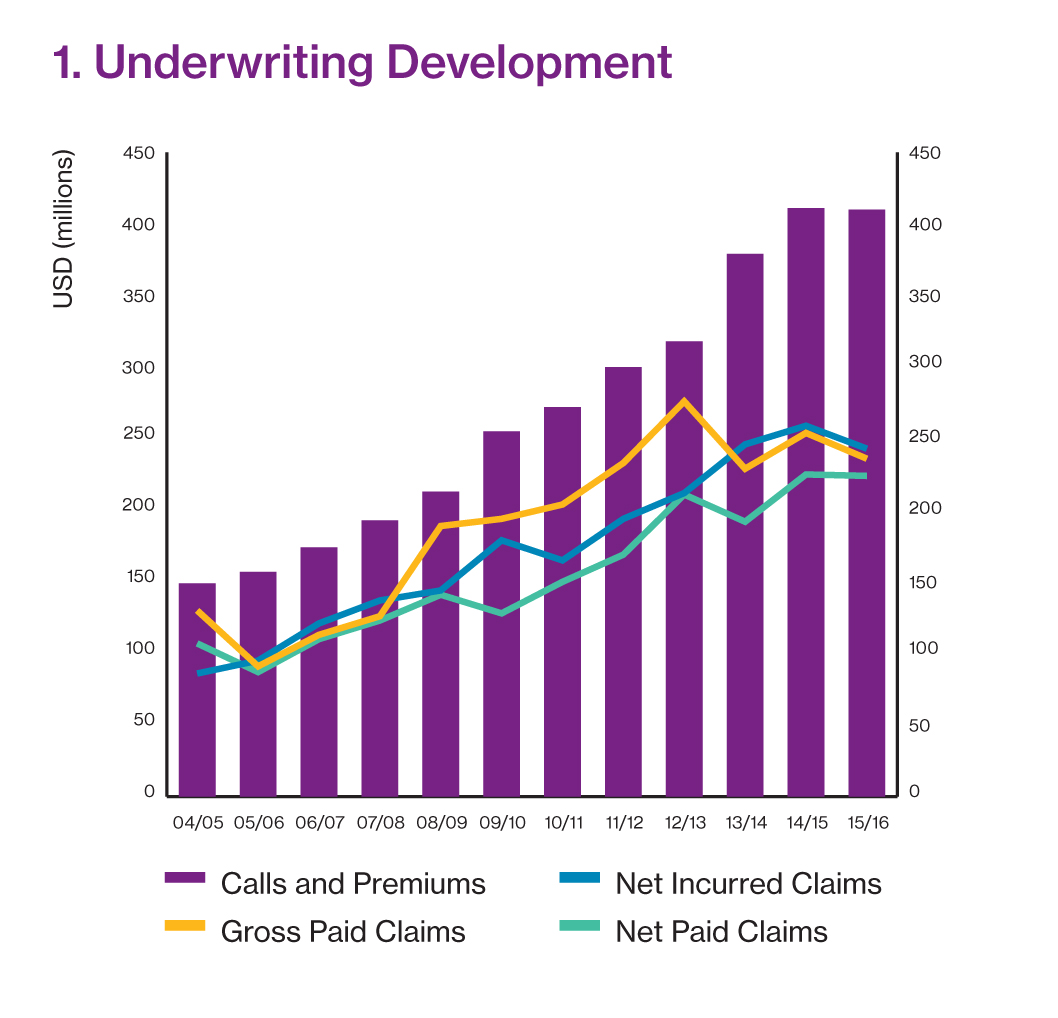
| Calls and Premiums | 379,391 | 411,246 | 409,980 |
| Reinsurance Premiums | -56,557 | -63,622 | -56,663 |
| Operating Expenses | -73,321 | -87,781 | -87,971 |
| Operating Income | 249,513 | 259,843 | 265,346 |
| Gross Paid Claims | 228,707 | 253,654 | 235,648 |
| Net Paid Claims | 192,171 | 224,598 | 224,197 |
| Net Change in Provision for Claims | 53,383 | 34,459 | 19,079 |
| Net Incurred Claims | 245,554 | 259,057 | 243,276 |
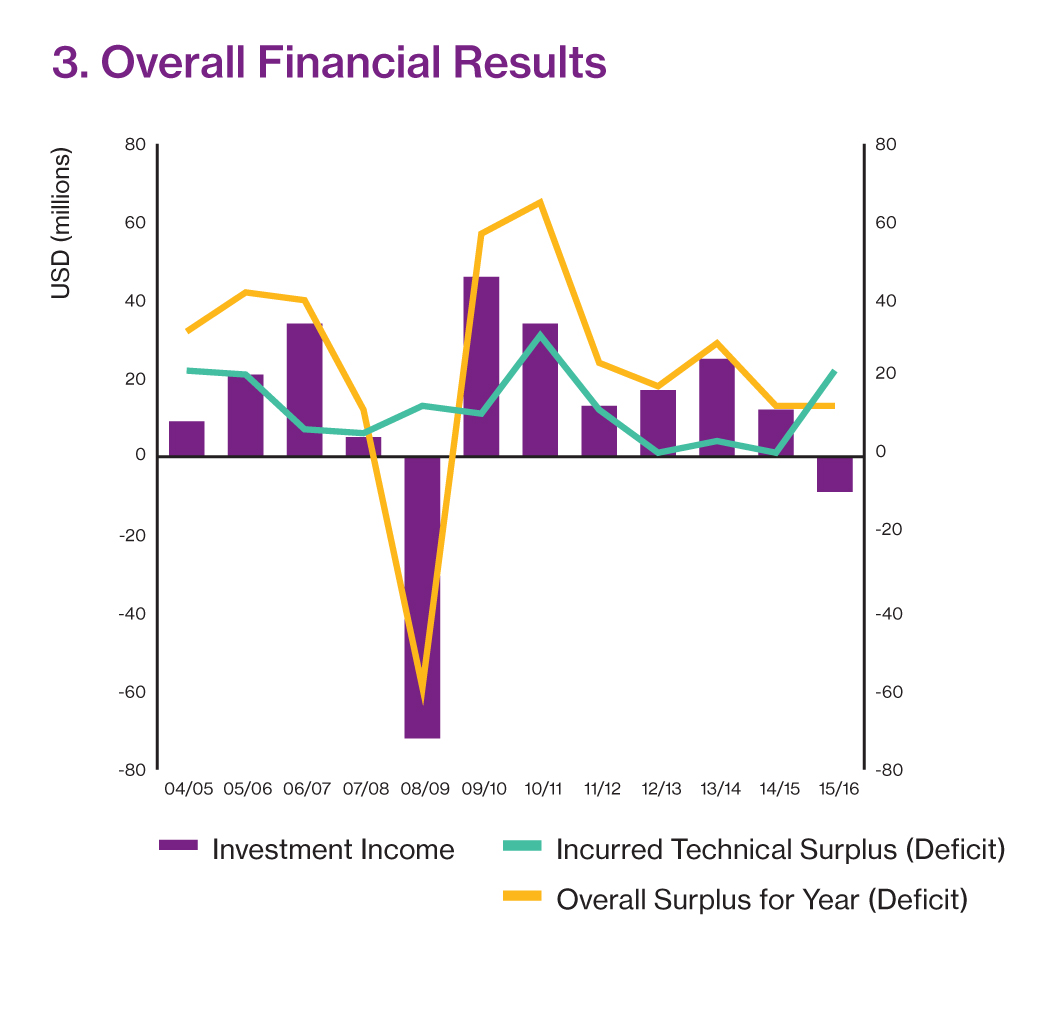
| Technical Surplus (Deficit) | 3,959 | 786 | 22,070 |
| Investment Income | 25,099 | 12,718 | -9,035 |
| Overall Surplus for Year (Deficit) | 29,058 | 13,504 | 13,035 |
| Balance Sheet | |||
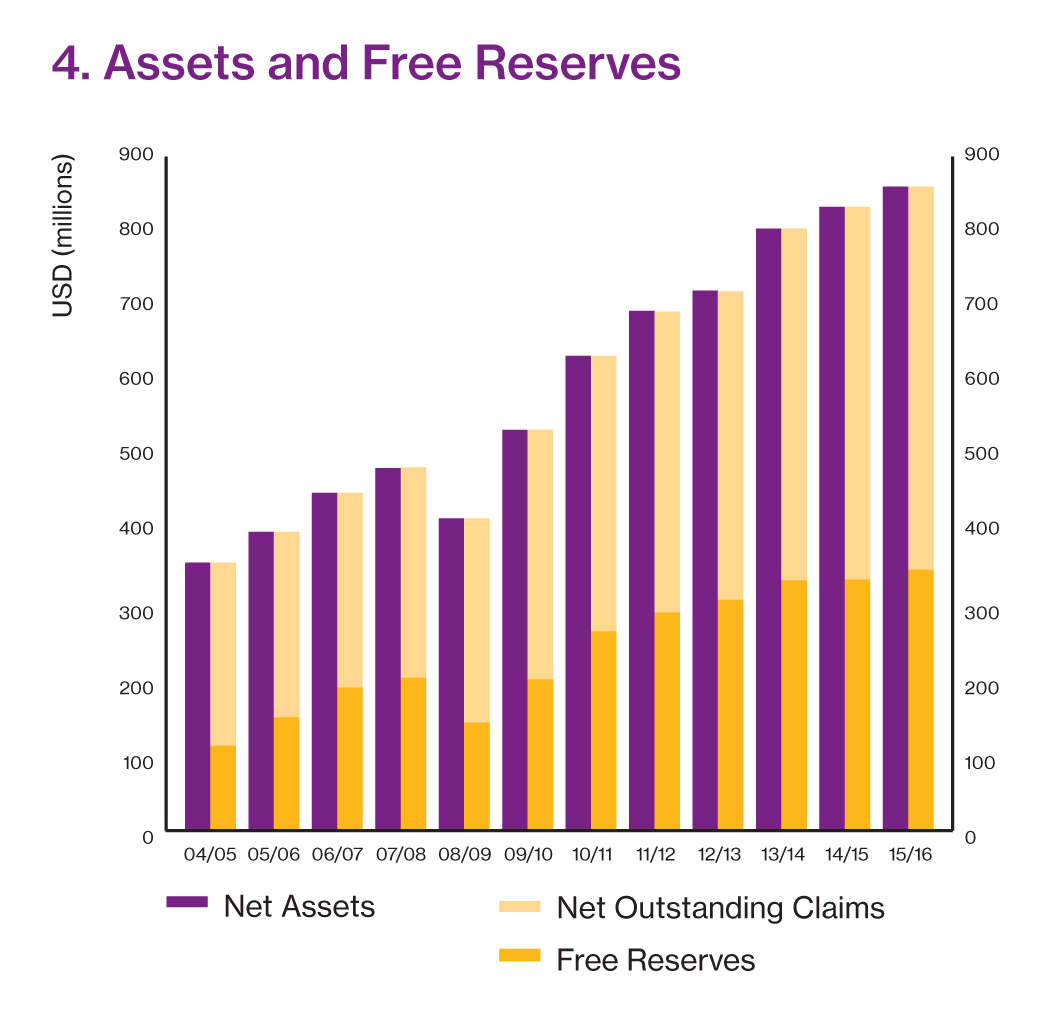
| Net Assets | 804,442 | 844,488 | 859,755 |
| Net Outstanding Claims | 470,159 | 497,578 | 511,526 |
| Free Reserves | 334,283 | 346,910 | 348,229 |
| Entered tonnage (GT) in millions | 2014 | 2015 | 2016 |
| Owned / Mutual | 75.9 | 74.0 | 78.0 |
| Skuld, probably sensibly, do not advise the entered tonnage on chartered and offshore business, however the premiums for these classes are as follows: | |||
| Chartered Premium (USD millions) | 55 | 50 | 50 |
| Offshore Premium (USD million) | 44 | 49 | 35* |
| S&P Rating History | 2014 | 2015 | 2016 |
| A | A | A | |
| Average Expense Ratio (AER) | 2013/14 | 2014/15 | 2015/16 |
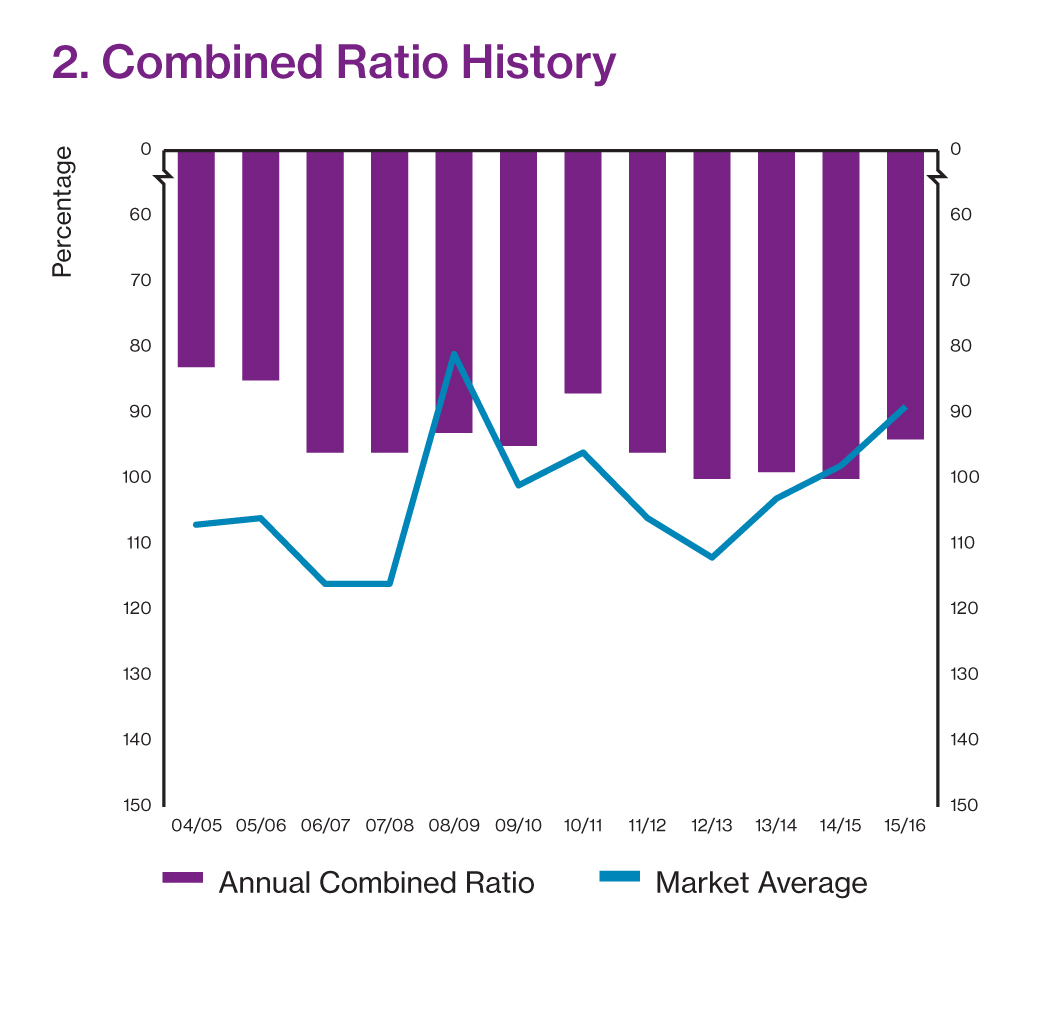
| Five years ending 20 February | 12.3 | 12.9 | 12.8 |
*Willis Towers Watson estimate for 2016