London P&I Club | www.londonpandi.com
2015/16 financial year results
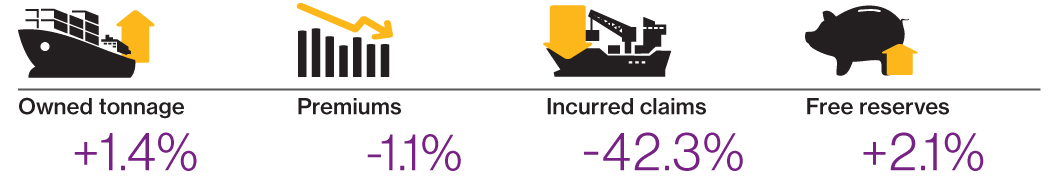
- Owned tonnage increased by 1.4%
- Premiums reduced by -1.1%
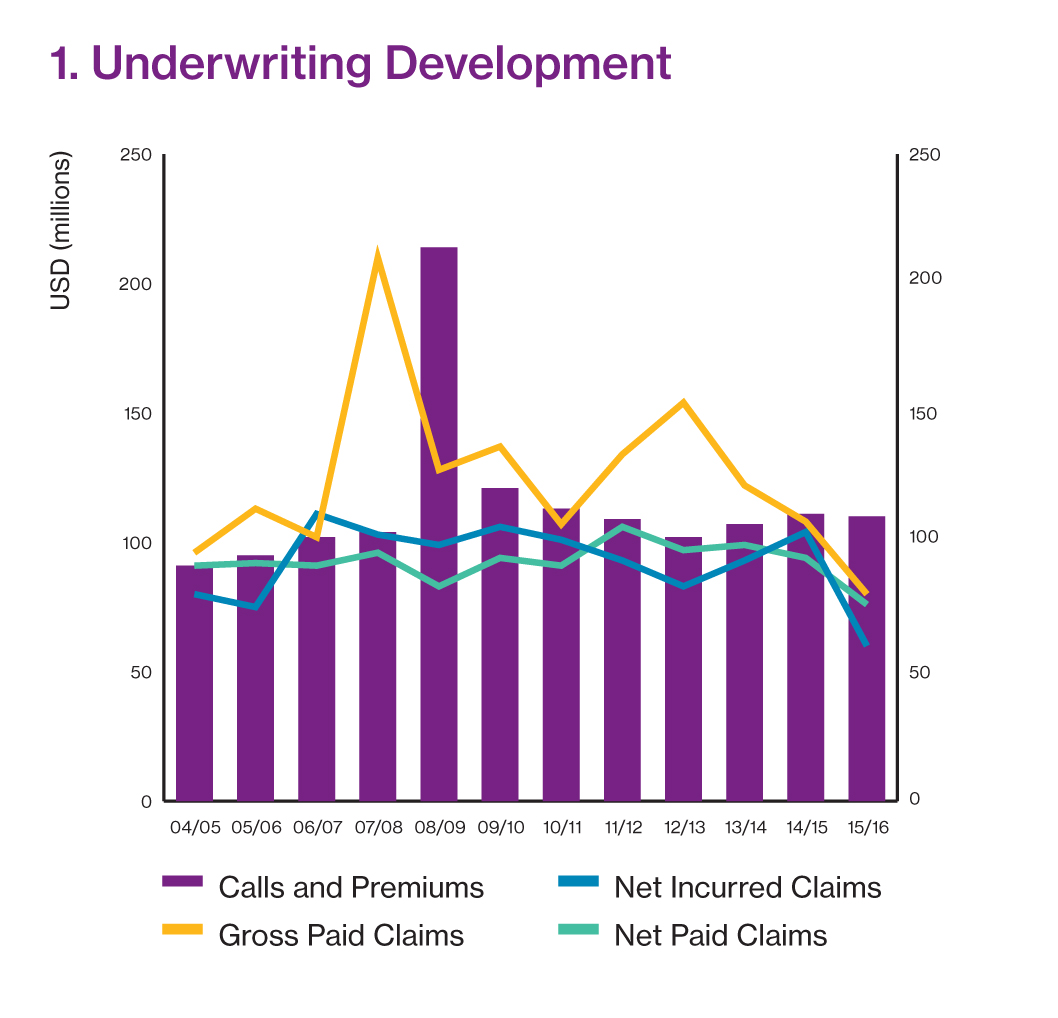
- Gross and net paid claims decreased by 25.5% and 19.2% respectively
- Estimates for outstanding claims reduced by USD 16.1 million
- Total net incurred claims reduced enormously, by 42.3%
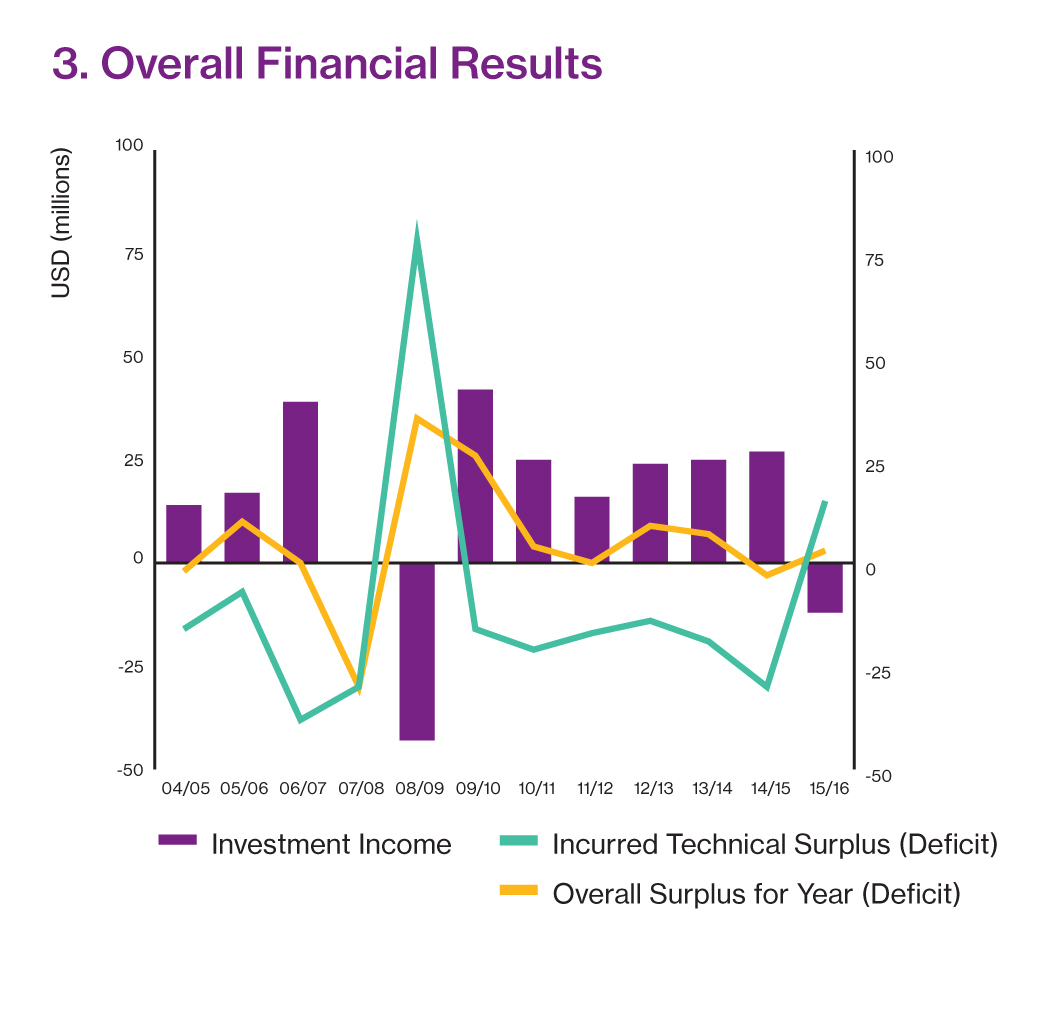
- Underwriting surplus of USD 15.3 million (a complete transformation from the USD 29.9 million underwriting loss in 2014/15)
- Investment loss of USD 12 million (-2.5% loss on investments)
- The underwriting surplus was sufficent to offset the investment loss, resulting in a small overall surplus for the year (USD 3.3 million)
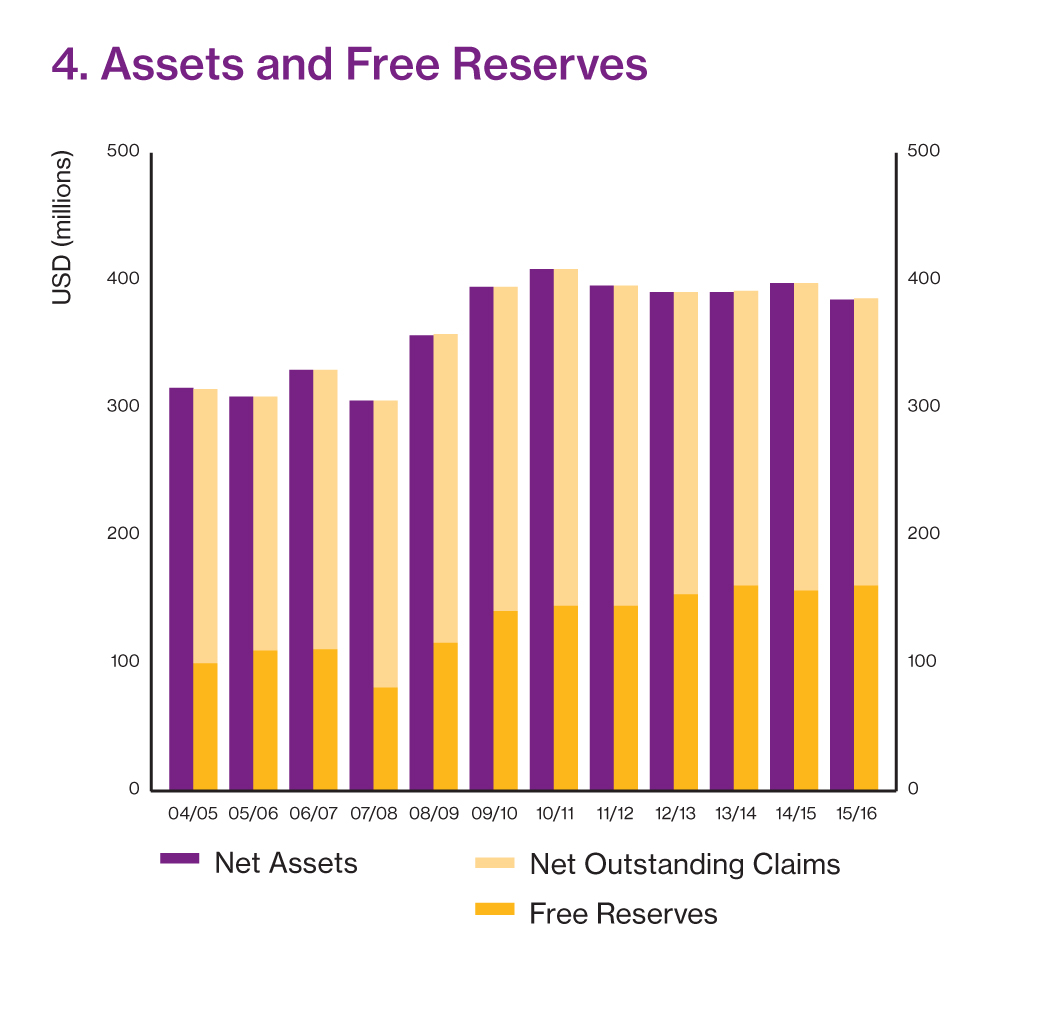
- Assets reduced by 3.2%, Free Reserves increased by 2.1%
Consolidated Financial Year Summary (USD 000s)
|
2013/14 |
2014/15 |
2015/16 |
| Income and Expenditure |
|
|
|
| Calls and Premiums |
106,895 |
111,290 |
110,072 |
| Reinsurance Premiums |
-20,754 |
-24,445 |
-22,670 |
| Operating Expenses |
-11,921 |
-12,483 |
-11,954 |
| Operating Income |
74,220 |
74,362 |
75,448 |
| Gross Paid Claims |
122,123 |
122,123 |
80,397 |
| Net Paid Claims |
98,893 |
94,424 |
76,266 |
| Net Change in Provision for Claims |
-5,937 |
9,853 |
-16,137 |
| Net Incurred Claims |
92,956 |
104,277 |
60,129 |
| Technical Surplus (Deficit) |
-18,736 |
-29,915 |
15,319 |
| Investment Income |
25,351 |
26,685 |
-12,026 |
| Overall Surplus for Year (Deficit) |
6,615 |
-3,230 |
3,293 |
| |
|
|
|
| Balance Sheet |
|
|
|
| Net Assets (market) |
391,495 |
398,118 |
385,273 |
| Net Outstanding Claims |
230,851 |
240,704 |
224,566 |
| Free Reserves |
160,644 |
157,414 |
160,707 |
| |
|
|
|
| Entered tonnage (GT) in millions |
2014 |
2015 |
2016 |
| Owned / Mutual |
43.1 |
43.8 |
44.4 |
| Chartered / Fixed |
5.2 |
8.7 |
7.5 |
| Total |
48.3 |
52.5 |
51.9 |
| |
|
|
|
| S&P Rating History |
2014 |
2015 |
2016 |
| |
BBB |
BBB |
BBB |
| |
|
|
|
| Average Expense Ratio (AER) |
2013/14 |
2014/15 |
2015/16 |
| Five years ending 20 February |
8.36 |
8.78 |
9.52 |