Japan P&I club | www.piclub.or.jp
2015/16 financial year results
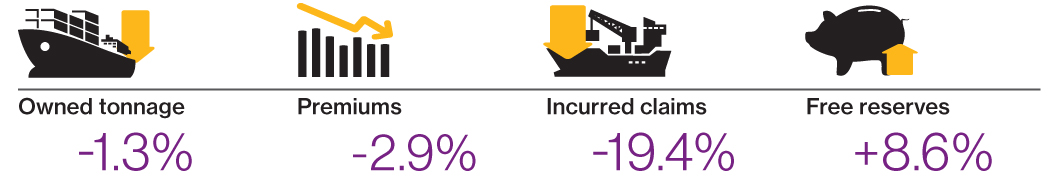
- Owned tonnage reduced by 1.3%
- Premiums reduced by 2.9%
- Operating expenses increased by 19.7%
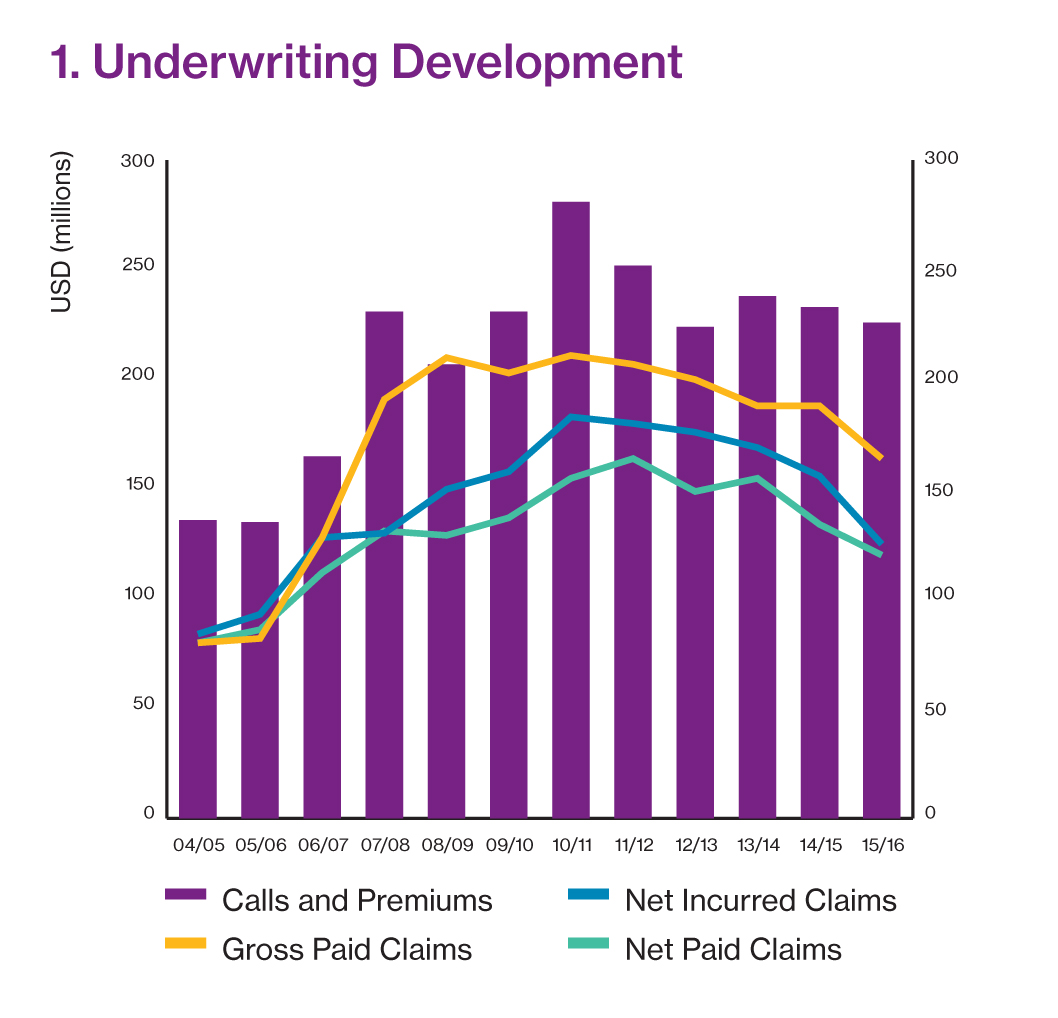
- Gross paid claims reduced by 12.7%, net paid claims reduced by 10.4%
- 19.4% reduction in total net incurred claims
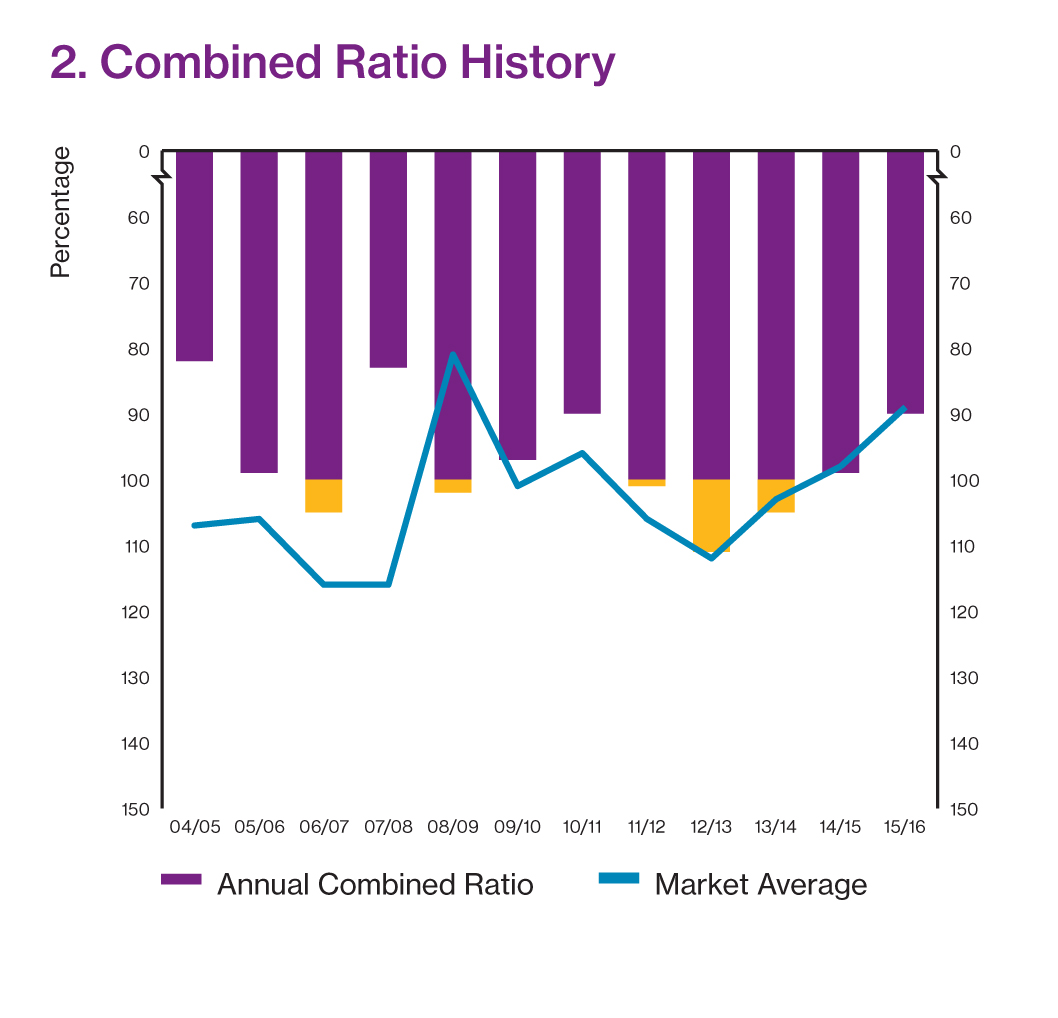
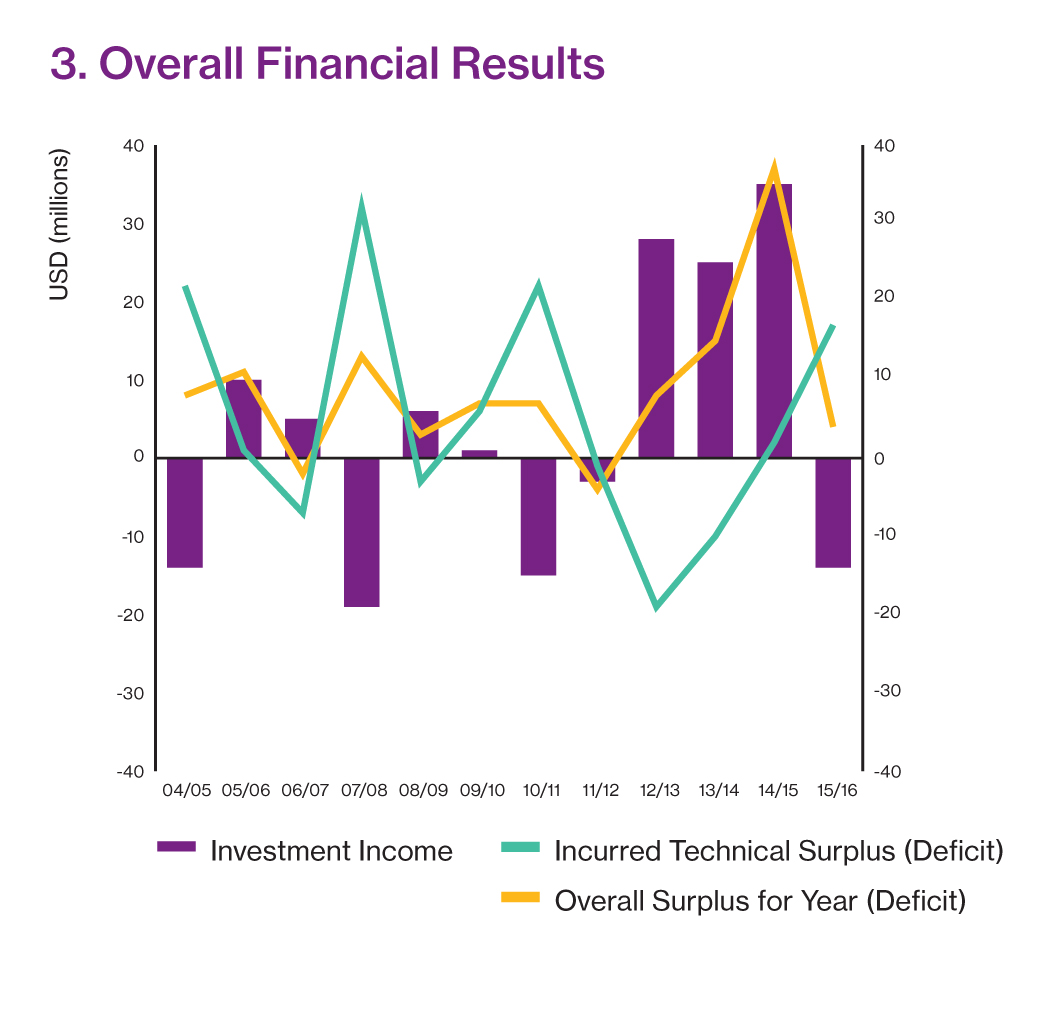
- USD 17.3 million underwriting surplus
- Investment return of -1.3%
- Overall surplus of USD 3.8 million, despite an Investment loss of
USD 13.6 million
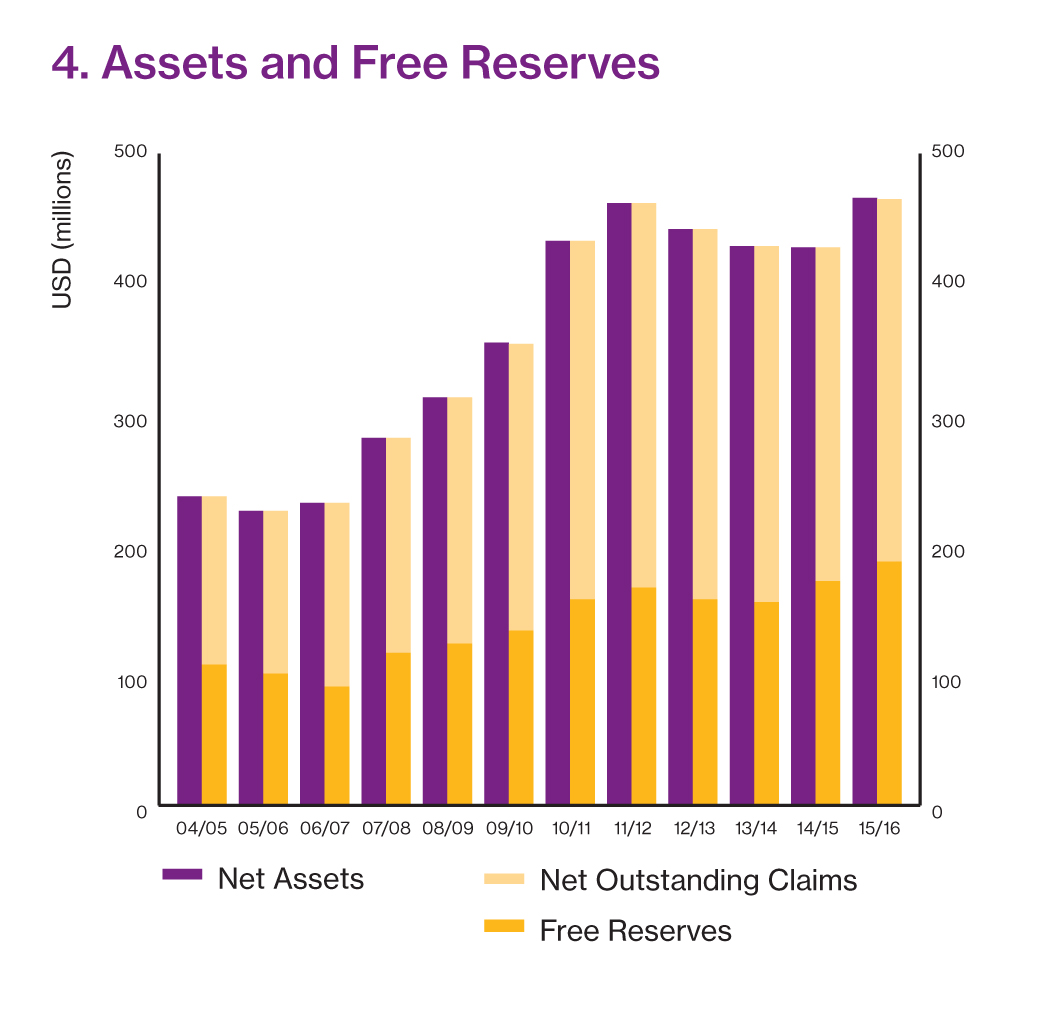
- Assets increased by 8.7%, free reserves increased by 8.6%
Consolidated Financial Year Summary (USD 000s)
|
2013/14 |
2014/15 |
2015/16 |
| Income and Expenditure |
|
|
|
| Calls and Premiums |
237,738 |
233,086 |
226,280 |
| Reinsurance Premiums |
-56,264 |
-55,257 |
-59,229 |
| Operating Expenses |
-22,775 |
-20,297 |
-24,290 |
| Operating Income |
158,699 |
157,532 |
142,761 |
| Gross Paid Claims |
187,628 |
187,595 |
163,741 |
| Net Paid Claims |
155,097 |
133,743 |
119,902 |
| Net Change in Provision for Claims |
13,451 |
21,892 |
5,514 |
| Net Incurred Claims |
168,548 |
155,635 |
125,416 |
| Technical Surplus (Deficit) |
-9,849 |
1,897 |
17,345 |
| Investment Income |
24,793 |
34,981 |
-13,578 |
| Overall Surplus for Year (Deficit) |
14,944 |
36,878 |
3,767 |
| |
|
|
|
| Balance Sheet |
|
|
|
| Net Assets (market) |
429,279 |
428,303 |
465,589 |
| Outstanding Claims (P&I Only) |
273,267 |
255,933 |
278,459 |
| Free Reserves |
156,012 |
172,370 |
187,130 |
| |
|
|
|
| Entered tonnage (GT) in millions |
2014 |
2015 |
2016 |
| Owned / Mutual |
89.3 |
90.8 |
89.6 |
| Owned / Fixed |
2.5 |
2.6 |
2.6 |
| Chartered / Fixed |
11.4 |
11.8 |
12.5 |
| Total |
103.2 |
105.2 |
104.7 |
| |
|
|
|
| S&P Rating History |
2014 |
2015 |
2016 |
| |
BBB+ |
BBB+ |
BBB+ |
| |
|
|
|
| Average Expense Ratio (AER) |
2013/14 |
2014/15 |
2015/16 |
| Five years ending 20 February |
5.73 |
5.25 |
5.18 |