Britannia is entered into a reinsurance contract with Boudicca Insurance Company Limited, located and regulated in Bermuda.
Boudicca Insurance holds assets in a way that cannot be dissipated to the detriment of the reinsurance contract with Britannia.
This is intended to be a tax efficient vehicle for a proportion of Britannia's reserves.
For the sake of effective comparison, we have consistently included Boudicca's assets in the figures set out in our summary page for Britannia.
| 2013/14 | 2014/15 | 2015/16 | |
|---|---|---|---|
| Income and Expenditure | |||
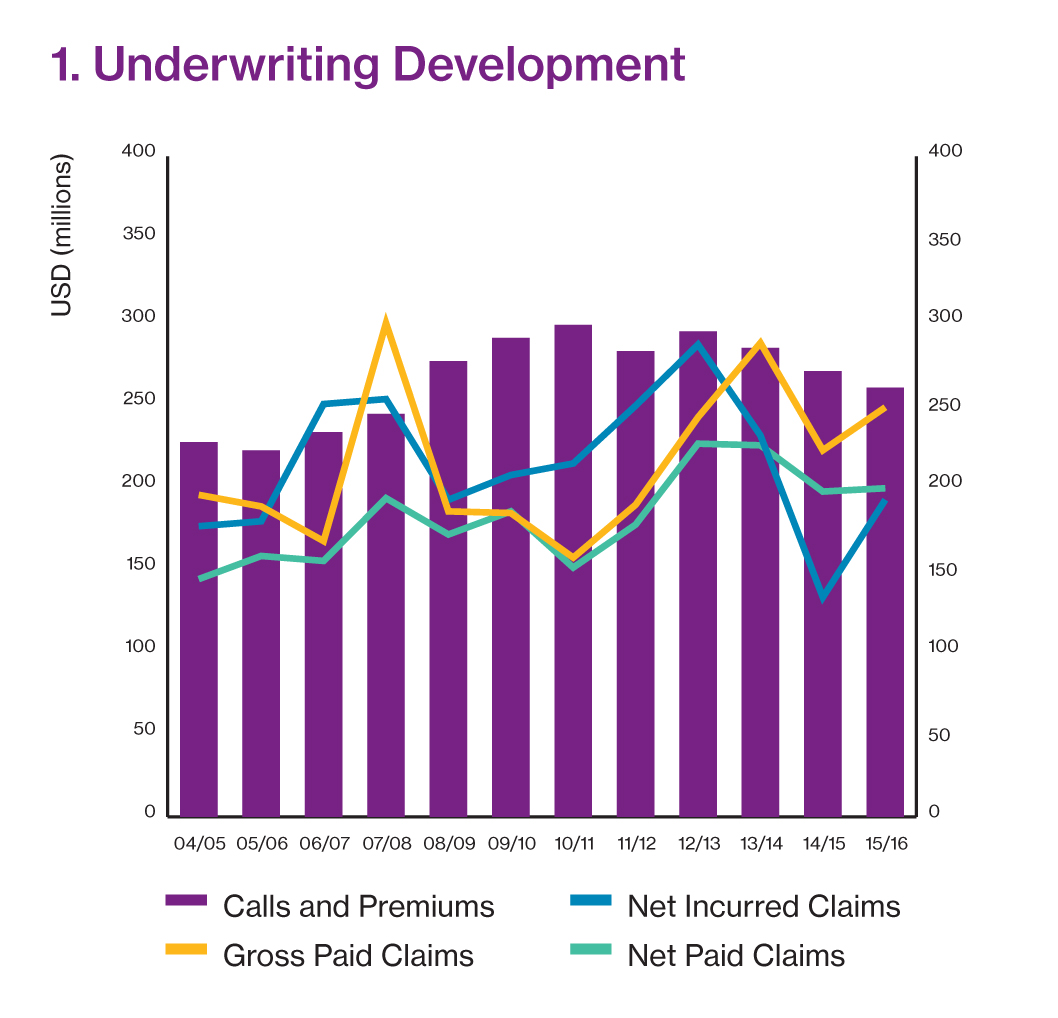
| Calls and Premiums | 284,167 | 269,726 | 260,272 |
| Reinsurance Premiums | -48,616 | -48,941 | -43,413 |
| Operating Expenses | -26,811 | -24,963 | -26,986 |
| Operating Income | 208,740 | 195,822 | 189,873 |
| Gross Paid Claims | 287,304 | 221,976 | 248,054 |
| Net Paid Claims | 225,258 | 196,557 | 198,512 |
| Net Change in Provision for Claims | 5,445 | -63,566 | -6,236 |
| Net Incurred Claims | 230,703 | 132,991 | 192,276 |
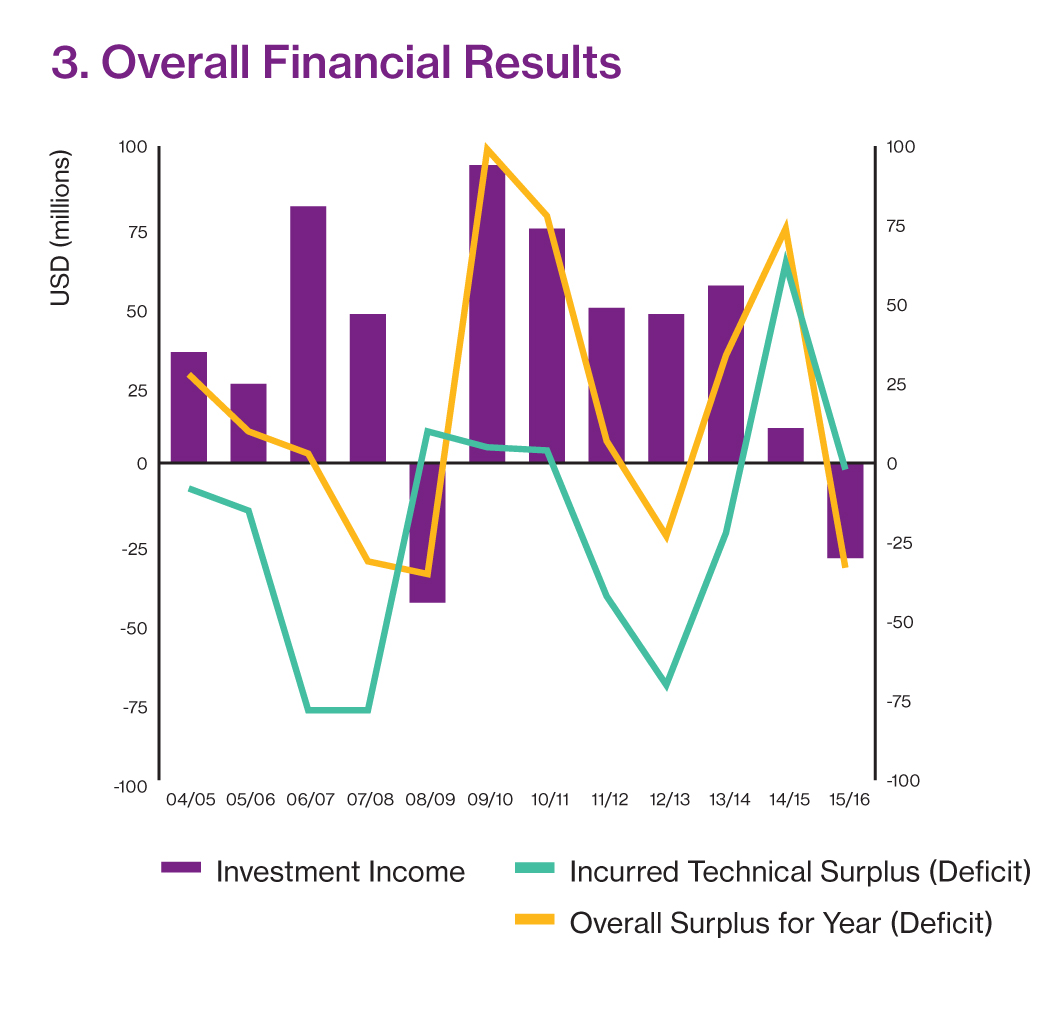
| Technical Surplus (Deficit) | -21,963 | 62,831 | -2,403 |
| Investment Income | 55,844 | 10,838 | -30,468 |
| Overall Surplus for Year (Deficit) | 33,881 | 73,669 | -32,871 |
| Balance sheet | |||
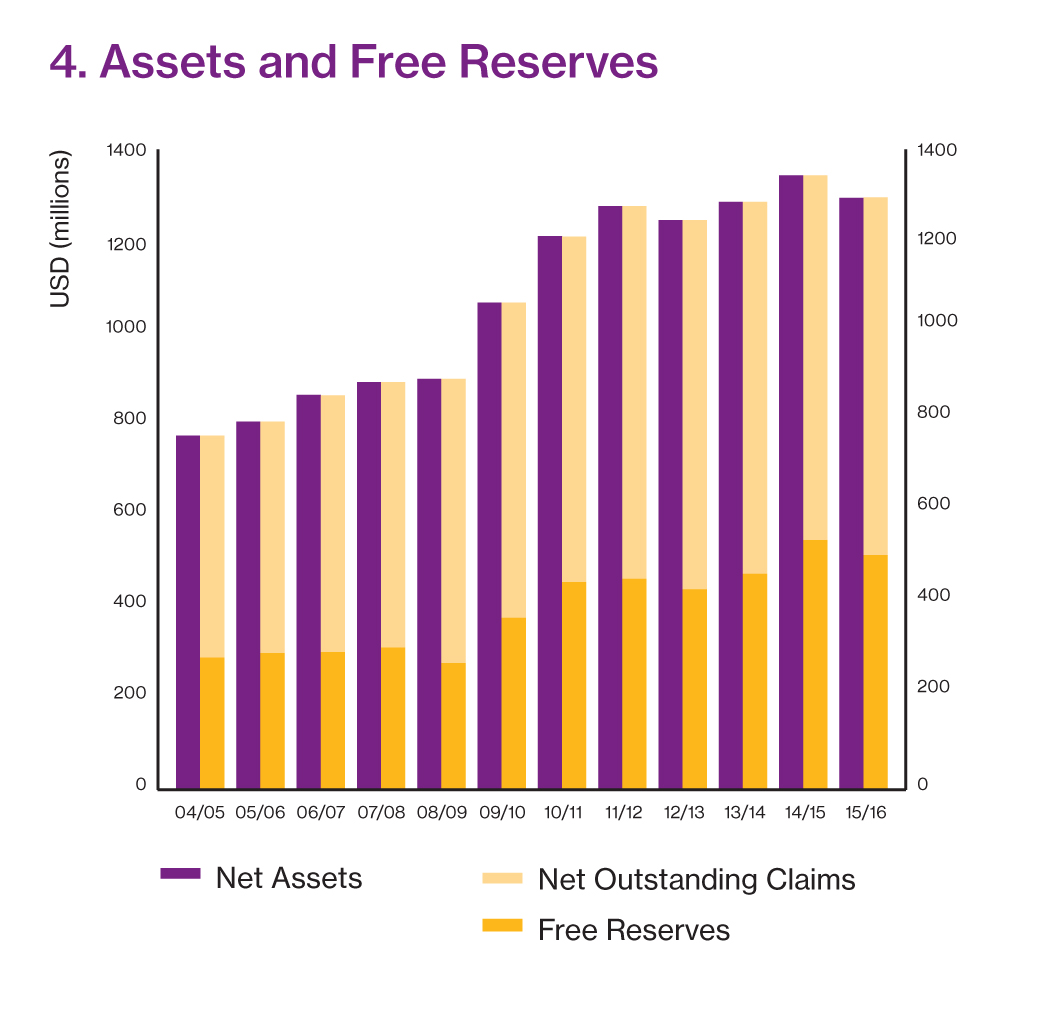
| Net Assets | 1,285,205 | 1,342,505 | 1,294,314 |
| Net Outstanding Claims | 813,307 | 796,938 | 781,618 |
| Free Reserves | 471,898 | 545,567 | 512,696 |
| NB the above figures include the combined figures of Britannia and Boudicca to show the complete group picture. The Assets of Boudicca included in the combined results above, are as follows: | |||
| 118,900 | 174,300 | 166,300 | |
| Entered tonnage (GT) in millions | 2014 | 2015 | 2016 |
| Owned / Mutual | 108.0 | 108.5 | 105.9 |
| Chartered / Fixed | 23.0 | 27.0 | 35.5 |
| Total | 131.0 | 135.5 | 141.4 |
| S&P Rating History | 2014 | 2015 | 2016 |
| A | A | A | |
| Average Expense Ratio (AER) | 2013/14 | 2014/15 | 2015/16 |
| 8.03 | 8.43 | 9.12 | |