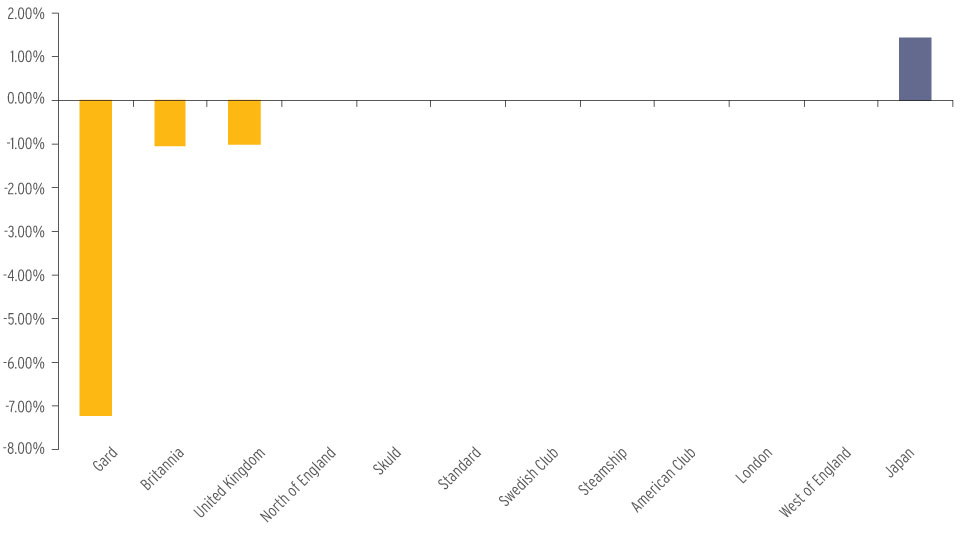
The following three graphs display a direct comparison of each club's deferred call performance, using the percentage variation measure, on average over three periods: 5 years, 10 years and 15 years.
Percentage Variation from estimated total call - average from 2010 to 2014
Percentage Variation from estimated total call - average from 2005 to 2014
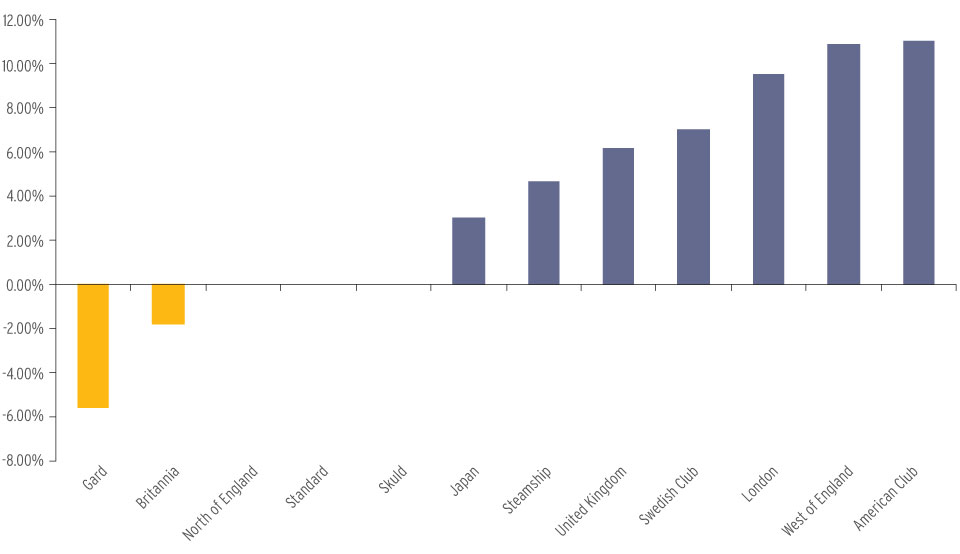
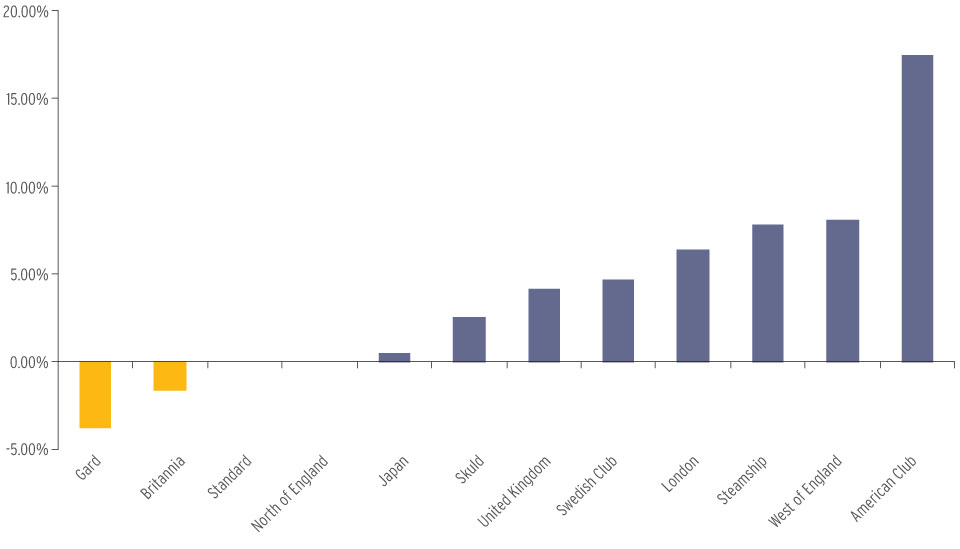
The pattern of the individual club performances naturally mirrors the improvement in the overall market averages. Across all the three periods only a minority of clubs charged less than they originally estimated (those less than zero percent). Over the last 15 years, 8 clubs charged more than originally estimated on average over the period (those greater than zero percent), this improves to 7 clubs on average over the last 10 years and only one club forced to over-call during the most recent 5 years. The remaining clubs were exactly on budget (on zero percent – no variation from estimated levels).
As with many other measures of performance for IG clubs, the range is significant. The range between the best and worst performing clubs over the last 15 years is in excess of 21%.
Percentage Variation from estimated total call - average from 2000 to 2014
N.B. The Shipowners' Club has one of the best historic supplementary call record in the IG, however in 2011 they amended their calling structure to move all members to the equivalent of an 'estimated total call' basis. Consequently their exceptional historic performance is unlikely to be repeated (though we expect them to continue entirely on budget). We have therefore omitted the Shipowners' Club from the three comparison graphs. The graphs compare the performance of the clubs able to write 'large ships' only.