We have included a table below setting out the release call percentages announced by each of the International Group (IG) clubs as at 30 November 2015.
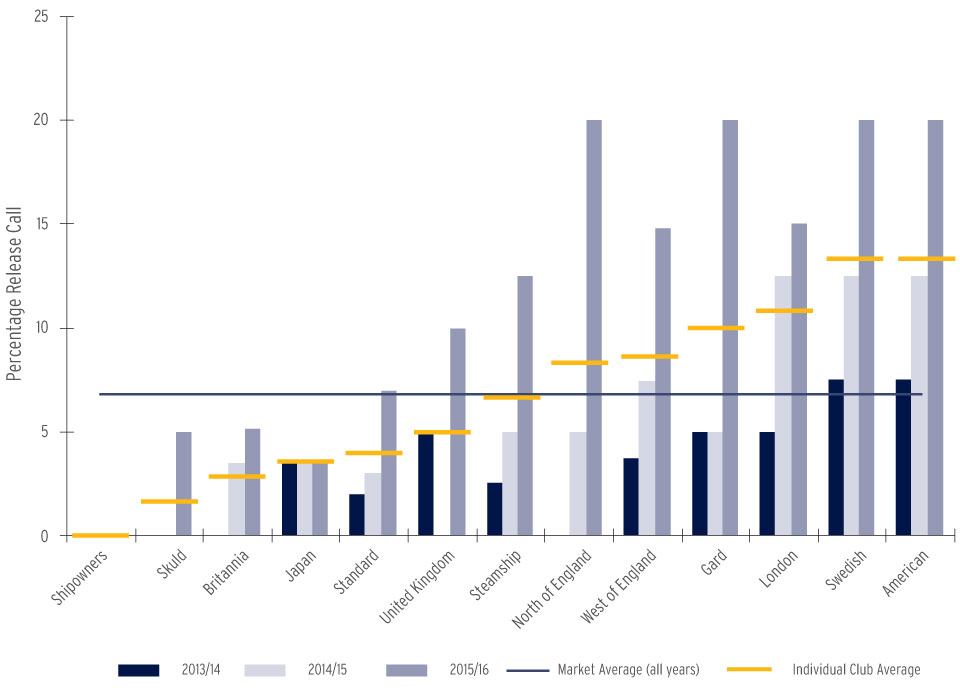
Due to the different calling structures of individual clubs, the announced figures are difficult to compare directly across the market (some clubs announce their release calls as a percentage of their advance call, whereas others publish release calls as a percentage of their estimated total call). To enable direct comparison, we have included a graph on the following page which adjusts all the announced release calls to percentages of estimated total calls.
N.B. The West of England is unique in separating the International Group reinsurance costs from their mutual premium. The release calls of this club would therefore only apply to the retained mutual premium of the club resulting in the release calls being slightly higher than the equivalent levels of any other club in the IG.
The graph shows the clubs arranged in order of their average release call for the three open years. .
| Club | 2013/14 | 2014/15 | 2015/16 | Changes since November 2014 Same Reduction |
|---|---|---|---|---|
| American | 7.5 | 12.5 | 20 | |
| Britannia | 0 | 5 | 7.5 | |
| Gard | 5 | 5 | 20 | |
| Japan | 5 | 5 | 5 | |
| London | 5 | 12.5 | 15 | |
| North of England | 0 | 5 | 20 | |
| Shipowners | 0 | 0 | 0 | |
| Skuld | 0 | 0 | 5 | |
| Standard (Europe/Asia) | 2 | 3 | 7 | |
| Steamship | 2.5 | 5 | 12.5 | |
| Swedish | 7.5 | 12.5 | 20 | |
| United Kingdom | 5 | 0 | 10 | |
| West of England | 5 | 10 | 20 |
Figures as announced by each club: percentages of Advance Calls or Estimated Total Calls in accordance with each club's normal calling structure.
As at 30 November 2015.
When comparing the published release calls to average levels of unbudgeted calls across the market, the figures continue to surprise.
Clubs will reasonably argue that any member has the option of providing a bank guarantee as security for potential future calls instead of actually paying release calls. This is entirely true, however it is not without cost.
P&I Release calls, as a percentage of estimated total calls
In addition to bank costs, there is frequently a requirement to tie up funds to secure the guarantee. In challenging economic times, where liquidity is all important, the bank guarantee route is far from straightforward and in many cases presents as large a barrier to movement as actually paying the release calls outright.