Gross paid claims were stable in 2014/15 maintaining the record high level for the IG market (nearly USD 3.4 billion).
Net paid claims reversed the previous year's result almost exactly, by increasing by 6.4% (net paid claims reduced by 6.3% in 2013/14). Net incurred claims however reduced by 3% compared to the previous 12 months.
At face value, the idea of net paid claims increasing while net incurred claims are decreasing appears counter intuitive, it is however essentially just an idiosyncrasy of the financial year basis reporting on long tail liability claims. In this particular financial year a number of clubs have reduced the estimates in 'back year' cases, whereas over the same period the claims actually paid during the 2014/15 financial year increased.
This graph displays the progression of gross paid claims, net paid and net incurred claims compared to total premium paid into the market, over the last 16 years.
Paid premiums vs. Gross paid claims, net paid claims and net incurred claims
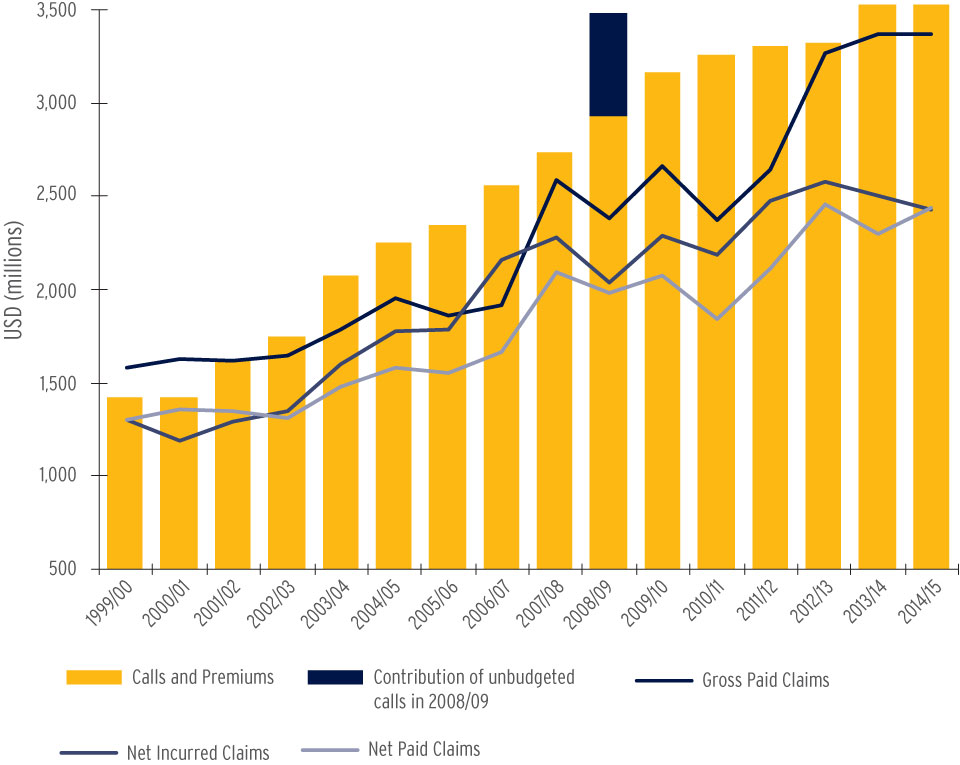
Claims volatility has been discussed in several previous reviews. The graph demonstrates this trend. Since the late 1980's claims inflation was relatively predictable and progressive. There has however been a marked increase in claims volatility since 2006/07. This trend is (obviously) shown most clearly in the gross paid claims results but the fluctuation in net paid and net incurred claims is similarly less predictable over the most recent 8 years.
Premium into the market increased almost exactly in line with the increase in tonnage insured (+4% and +3.9% respectively).